NVIDIA (NVDA) – Daily Analysis
The chart is showing something interesting here:
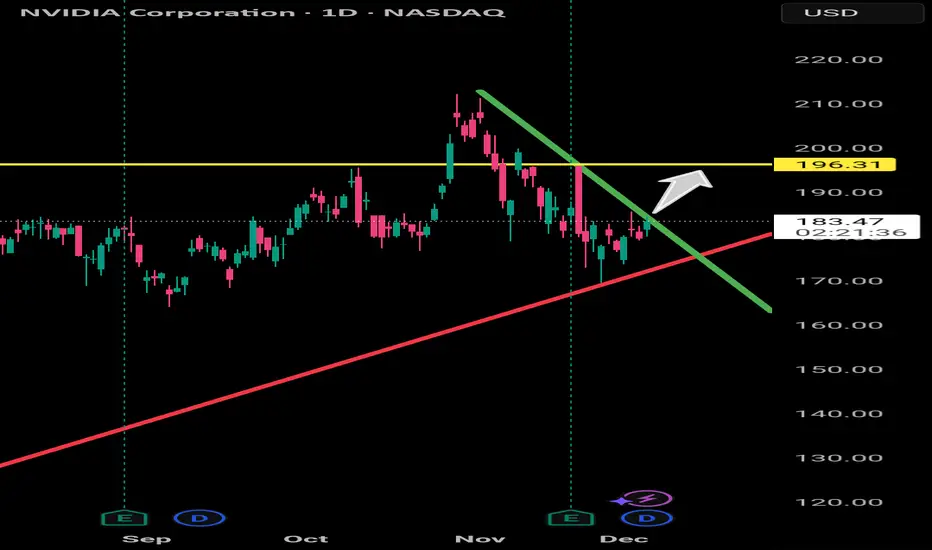
Price has been trending down under the green bearish trendline, but we’re now seeing bullish pressure building right on top of the red long-term bullish trendline.
This creates a compression zone — and usually, NVIDIA doesn’t stay quiet in these zones for long.
What’s the key idea?
If price breaks and closes above the green trendline, momentum can shift bullish again, and the next logical magnet is the yellow horizontal level at 196.31.
Why that level?
It’s a major historical reaction zone.
It aligns as a clean liquidity pool.
Market loves to revisit these "00-zones" and round-number clusters.
Probability Outlook
With current price basing at 183.59 and respecting the bullish diagonal:
➡️ A move toward the yellow line (196.31) is highly probable once the trendline break is confirmed.
The chart is showing something interesting here:
Price has been trending down under the green bearish trendline, but we’re now seeing bullish pressure building right on top of the red long-term bullish trendline.
This creates a compression zone — and usually, NVIDIA doesn’t stay quiet in these zones for long.
What’s the key idea?
If price breaks and closes above the green trendline, momentum can shift bullish again, and the next logical magnet is the yellow horizontal level at 196.31.
Why that level?
It’s a major historical reaction zone.
It aligns as a clean liquidity pool.
Market loves to revisit these "00-zones" and round-number clusters.
Probability Outlook
With current price basing at 183.59 and respecting the bullish diagonal:
➡️ A move toward the yellow line (196.31) is highly probable once the trendline break is confirmed.
면책사항
해당 정보와 게시물은 금융, 투자, 트레이딩 또는 기타 유형의 조언이나 권장 사항으로 간주되지 않으며, 트레이딩뷰에서 제공하거나 보증하는 것이 아닙니다. 자세한 내용은 이용 약관을 참조하세요.
면책사항
해당 정보와 게시물은 금융, 투자, 트레이딩 또는 기타 유형의 조언이나 권장 사항으로 간주되지 않으며, 트레이딩뷰에서 제공하거나 보증하는 것이 아닙니다. 자세한 내용은 이용 약관을 참조하세요.