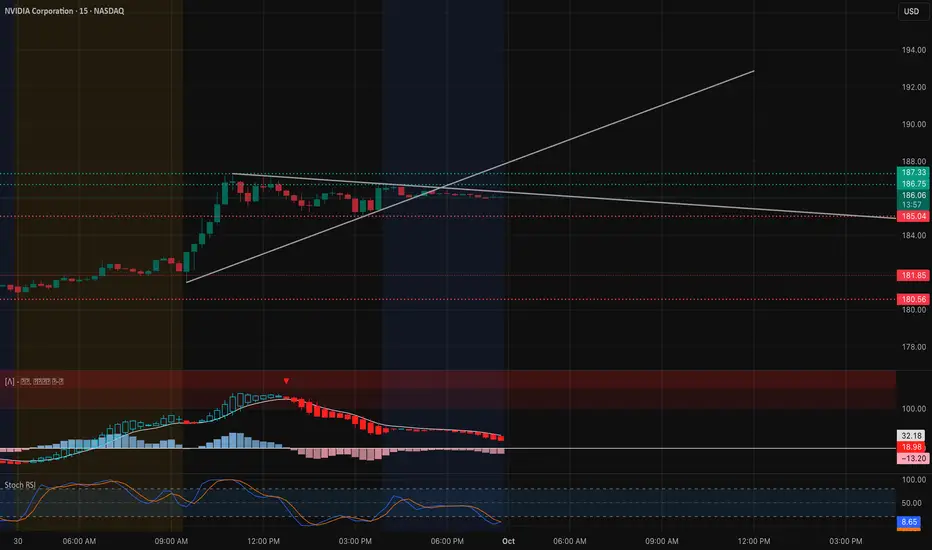
Intraday View (15-Min Chart)
NVDA ripped higher early but is consolidating around $186 into the close. Price is riding the intraday trendline, though momentum is fading.
* Support Levels: $185.00, $181.85, $180.56
* Resistance Levels: $186.75, $187.33, $188.00
* Indicators: MACD is losing steam with red bars extending. Stoch RSI is buried at lows, showing possible oversold conditions.
📌 Intraday Thought (Oct. 1): If $185 holds, NVDA could bounce back toward $187–$188. A break below $185 risks a flush to $182 and possibly $181.5. Scalpers can lean long on $185 support with tight risk, or fade near $187.5 if momentum stalls.
Options & Swing View (1H + GEX)

Gamma positioning shows a clear setup:
* Call walls: Big resistance at $187.5–$190, with stacked GEX above.
* Put support: Clustered near $175–$170, with a hard floor around $170.
This implies NVDA is pinned between $185–$190 short term. A confirmed break over $187.5 opens upside momentum toward $190–$195, while losing $185 risks a retrace back to $182 → $175 zone.
* Bullish Play (Oct. 1): Calls or debit spreads targeting $190–$195 if $187.5 breaks on volume.
* Bearish Hedge: Short puts toward $182 → $175 if $185 fails.
* Neutral Play: Iron condor between $175–$190 for premium capture while NVDA consolidates.
My Thoughts (Oct. 1)
NVDA is pressing right into a breakout zone. The tape favors bulls as long as $185 holds, but momentum is clearly cooling on intraday charts. I’d treat $187.5 as the trigger line: over it, we could squeeze to $190+ quickly. Below $185, downside opens fast toward $182. Flexibility is key here—trade the levels, not the noise.
Disclaimer: This analysis is for educational purposes only and does not constitute financial advice. Always do your own research and manage risk before trading.
NVDA ripped higher early but is consolidating around $186 into the close. Price is riding the intraday trendline, though momentum is fading.
* Support Levels: $185.00, $181.85, $180.56
* Resistance Levels: $186.75, $187.33, $188.00
* Indicators: MACD is losing steam with red bars extending. Stoch RSI is buried at lows, showing possible oversold conditions.
📌 Intraday Thought (Oct. 1): If $185 holds, NVDA could bounce back toward $187–$188. A break below $185 risks a flush to $182 and possibly $181.5. Scalpers can lean long on $185 support with tight risk, or fade near $187.5 if momentum stalls.
Options & Swing View (1H + GEX)
Gamma positioning shows a clear setup:
* Call walls: Big resistance at $187.5–$190, with stacked GEX above.
* Put support: Clustered near $175–$170, with a hard floor around $170.
This implies NVDA is pinned between $185–$190 short term. A confirmed break over $187.5 opens upside momentum toward $190–$195, while losing $185 risks a retrace back to $182 → $175 zone.
* Bullish Play (Oct. 1): Calls or debit spreads targeting $190–$195 if $187.5 breaks on volume.
* Bearish Hedge: Short puts toward $182 → $175 if $185 fails.
* Neutral Play: Iron condor between $175–$190 for premium capture while NVDA consolidates.
My Thoughts (Oct. 1)
NVDA is pressing right into a breakout zone. The tape favors bulls as long as $185 holds, but momentum is clearly cooling on intraday charts. I’d treat $187.5 as the trigger line: over it, we could squeeze to $190+ quickly. Below $185, downside opens fast toward $182. Flexibility is key here—trade the levels, not the noise.
Disclaimer: This analysis is for educational purposes only and does not constitute financial advice. Always do your own research and manage risk before trading.
면책사항
이 정보와 게시물은 TradingView에서 제공하거나 보증하는 금융, 투자, 거래 또는 기타 유형의 조언이나 권고 사항을 의미하거나 구성하지 않습니다. 자세한 내용은 이용 약관을 참고하세요.
면책사항
이 정보와 게시물은 TradingView에서 제공하거나 보증하는 금융, 투자, 거래 또는 기타 유형의 조언이나 권고 사항을 의미하거나 구성하지 않습니다. 자세한 내용은 이용 약관을 참고하세요.