Short-Term Analysis (1-2 weeks):
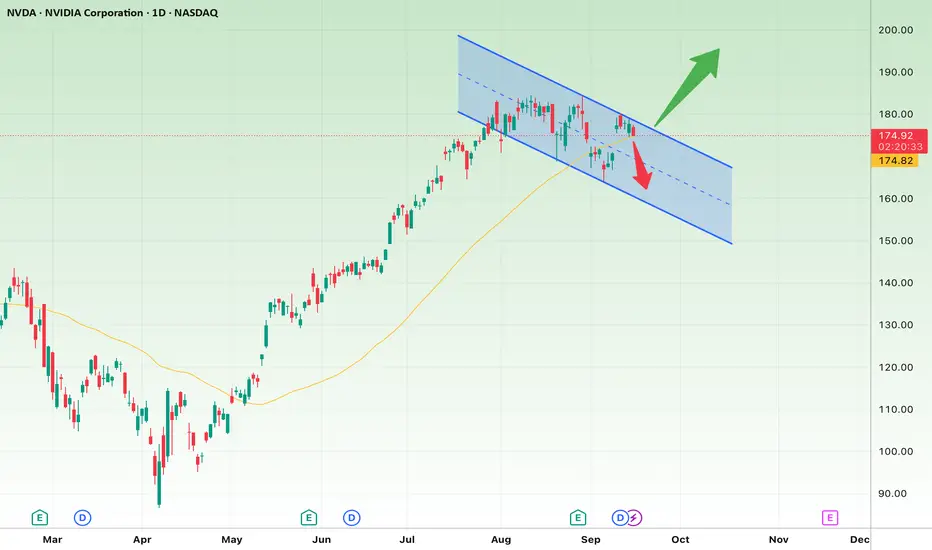
Price Action: The current price is near the lower boundary of the descending channel, with the support level around $174.80. This could act as a good entry point for a potential rebound.
Technical Insights: The chart shows a descending channel, indicating that if the price reaches the lower boundary, there's a likelihood of a short-term reversal.
Price Target: In the short term, the first target would be around $180, which is near the upper resistance of the channel. If broken, a further move toward $185 could be possible.
Stop Loss: If the support at $174.80 breaks, the stop loss could be set at $170.
Long-Term Analysis (1-3 months):
Price Action: If the price manages to break out of the descending channel, a continued bullish trend would likely push the price toward $190. This is a strong resistance level.
Technical Insights: A breakout from the descending channel would indicate a continuation of the bullish trend. In that case, the price might reach higher levels above $190.
Price Target: In the long run, if the price breaks above the channel, the next target could be $200.
Stop Loss: In case the price drops below $170 in the long term, the bearish trend would likely continue, with a stop loss set at $160.
Summary:
Short-Term: Support at $174.80, with a price target of $180 and a stop loss at $170.
Long-Term: Bullish target at $190-$200, with a stop loss at $160.
Always consider fundamental news that could significantly impact price movements.
면책사항
해당 정보와 게시물은 금융, 투자, 트레이딩 또는 기타 유형의 조언이나 권장 사항으로 간주되지 않으며, 트레이딩뷰에서 제공하거나 보증하는 것이 아닙니다. 자세한 내용은 이용 약관을 참조하세요.
면책사항
해당 정보와 게시물은 금융, 투자, 트레이딩 또는 기타 유형의 조언이나 권장 사항으로 간주되지 않으며, 트레이딩뷰에서 제공하거나 보증하는 것이 아닙니다. 자세한 내용은 이용 약관을 참조하세요.