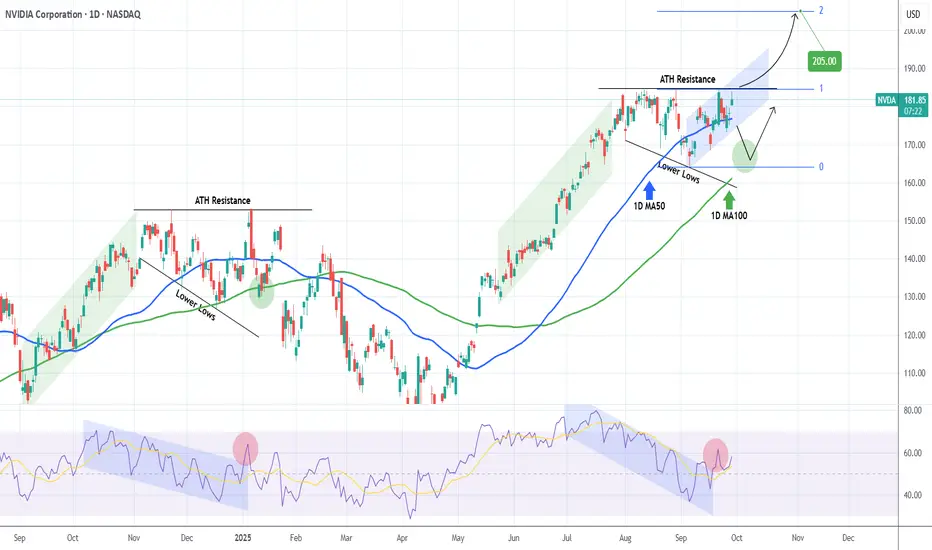
NVIDIA Corporation (NVDA) almost hit today its All Time High (ATH), which is currently its Resistance level. That is technically the top of a Descending Triangle pattern that the stock has been trading in since the start of August.
The last time we saw a similar pattern was during NVDA's previous ATH formation in November 2024 - January 2025. Identical price actions as well as 1D RSI sequences among the two fractals.
Based on that, we should be past a January 07 2025 ATH Resistance rejection, which targeted the 1D MA100 (green trend-line) before the next bounce. As a result, until the current ATH Resistance breaks, we should technically see a pull-back towards $166/67.
This time however, there is a strong case for a ATH break-out as the price is trading within a short-term (blue) Channel Up. As long as this holds, it can keep making Higher Highs, with the next one technically aiming above the ATH Resistance.
In any case, if that level breaks, we expect the price to target the 2.0 Fibonacci extension at just above $200.
-------------------------------------------------------------------------------
** Please LIKE 👍, FOLLOW ✅, SHARE 🙌 and COMMENT ✍ if you enjoy this idea! Also share your ideas and charts in the comments section below! This is best way to keep it relevant, support us, keep the content here free and allow the idea to reach as many people as possible. **
-------------------------------------------------------------------------------
💸💸💸💸💸💸
👇 👇 👇 👇 👇 👇
👑Best Signals (Forex/Crypto+70% accuracy) & Account Management (+20% profit/month on 10k accounts)
💰Free Channel t.me/tradingshotglobal
🤵Contact info@tradingshot.com t.me/tradingshot
🔥New service: next X100 crypto GEMS!
💰Free Channel t.me/tradingshotglobal
🤵Contact info@tradingshot.com t.me/tradingshot
🔥New service: next X100 crypto GEMS!
면책사항
해당 정보와 게시물은 금융, 투자, 트레이딩 또는 기타 유형의 조언이나 권장 사항으로 간주되지 않으며, 트레이딩뷰에서 제공하거나 보증하는 것이 아닙니다. 자세한 내용은 이용 약관을 참조하세요.