Shares of Nvidia took a hit during Thursday’s session, losing about 1.5%. Technically, the trend remains northbound, though near-term price action has shown a few lower lows and lower highs: early signs of a downtrend.
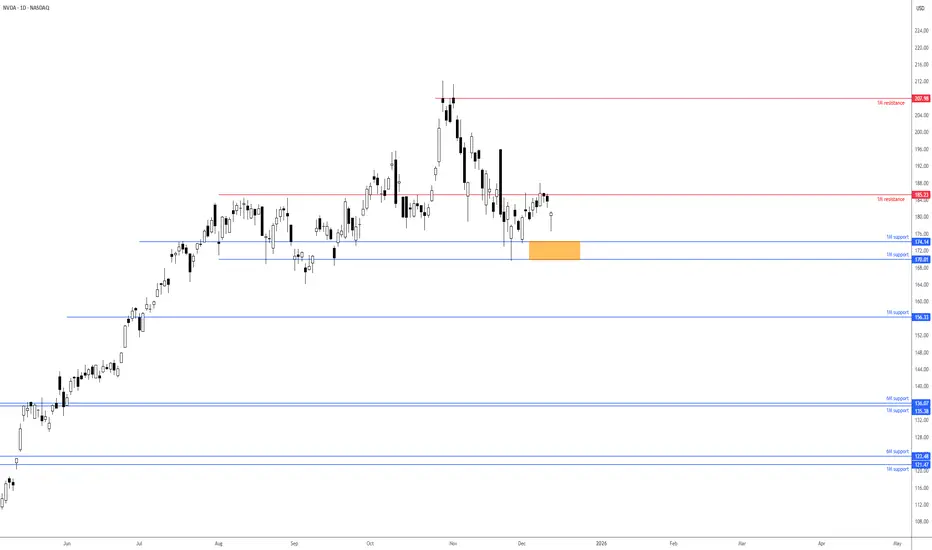
1M resistance recently made a show at US$185.23 and withstood a few upside attempts. 1M support is nearby between US$170.01 and US$174.14, with a break under here unbolting the door to another layer of 1M support from US$156.33. Alternatively, pushing above US$185.23 would help bolster the long-term trend, and potentially attract fresh buying to 1M resistance at US$207.98, closely shadowed by the all-time high of US$212.19.
Ultimately, the direction of travel for this Stock will depend on whether it breaks above resistance at US$185.23, encouraging buying, or below the support zone between US$170.01 and US$174.14, which could prompt further underperformance.
Written by the FP Markets Research Team
면책사항
해당 정보와 게시물은 금융, 투자, 트레이딩 또는 기타 유형의 조언이나 권장 사항으로 간주되지 않으며, 트레이딩뷰에서 제공하거나 보증하는 것이 아닙니다. 자세한 내용은 이용 약관을 참조하세요.
면책사항
해당 정보와 게시물은 금융, 투자, 트레이딩 또는 기타 유형의 조언이나 권장 사항으로 간주되지 않으며, 트레이딩뷰에서 제공하거나 보증하는 것이 아닙니다. 자세한 내용은 이용 약관을 참조하세요.