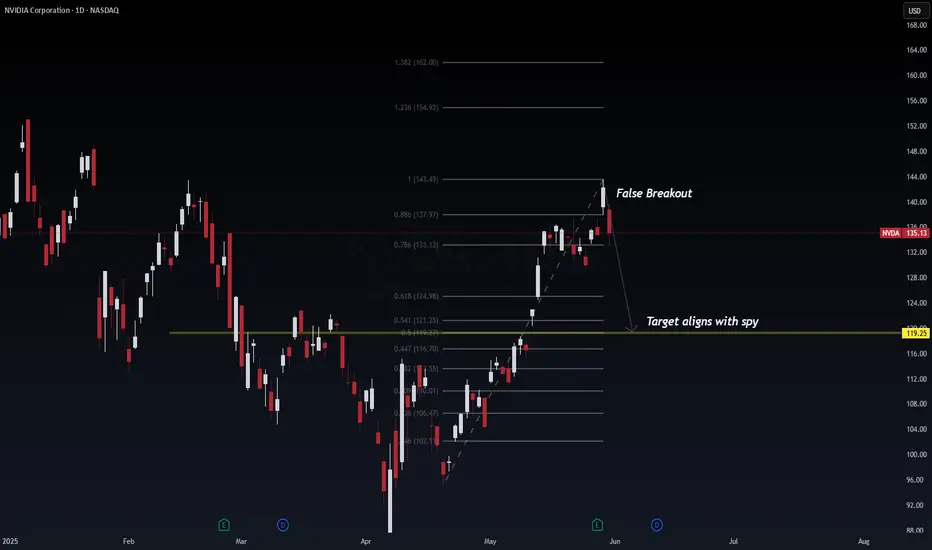
NVDA printed what appears to be a false breakout at the 1.0 Fib extension level ($143.49), now reversing sharply — potentially aligning with SPY's projected retracement. This presents a high-probability mean reversion setup.
📉 Technical Breakdown
Current Price: $135.13
False Breakout Zone: 1.0 Fib extension ($143.49)
Key Breakdown Zone: 0.786 Fib ($133.12)
Probable Retest Zones:
0.618 Fib: $124.98
0.5 Fib: $121.25
Target: $119.25 (confluence with SPY's demand zone)
🔍 Probabilistic Trade Outlook
⚠️ False breakout + bearish engulfing = 80% probability of continued downside.
📉 Targeting $119.25 = 65% probability as it aligns with institutional levels and SPY’s projected retrace.
💡 Volume and momentum suggest profit-taking and supply absorption.
🌐 Macro Context (May 31, 2025)
AI bubble cooling: Rotation from AI mega caps into broader market value plays.
SPY & NVDA correlation: NVDA typically leads tech-heavy indices — the confluence here could signal broader market pullback.
Fed Policy Uncertainty: No rate cut priced in for June; July will be key.
🧠 Institutional View
This setup echoes the "buy-side trap" — liquidity engineered above previous highs, now reversing to collect resting orders below. This is textbook Smart Money Concepts (SMC) in play.
🧭 Trade Setup
Entry: On confirmed breakdown below 0.786 ($133.12)
Target: $119.25
Stop: $143.60 (above fakeout zone)
Optional Re-entry: Near 0.618 ($124.98) on confirmation
📌 If NVDA hits the $119–121 zone in confluence with SPY’s bounce region, a high-R:R reversal trade may follow.
#NVDA #FibonacciLevels #SmartMoney #LiquiditySweep #TechStocks #MarketReversal #AIStocks #TradingView #WaverVanir
노트
주문취소됨
WaverVanir ⚡ To grow and conquer
stocktwits.com/WaverVanir | wavervanir.com | buymeacoffee.com/wavervanir
Not Investment Advice
stocktwits.com/WaverVanir | wavervanir.com | buymeacoffee.com/wavervanir
Not Investment Advice
면책사항
이 정보와 게시물은 TradingView에서 제공하거나 보증하는 금융, 투자, 거래 또는 기타 유형의 조언이나 권고 사항을 의미하거나 구성하지 않습니다. 자세한 내용은 이용 약관을 참고하세요.