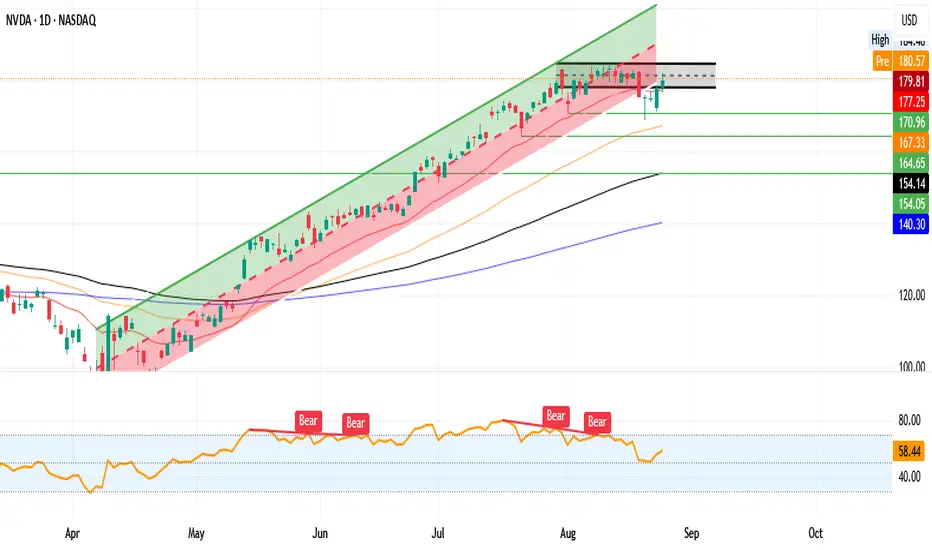
NVIDIA  NVDA continues to respect its long-term ascending channel (green zone), with price currently trading at $179.81 (+1.02%). After the recent pullback toward the mid-channel, buyers stepped back in, defending key moving averages and reclaiming short-term momentum.
- Support Levels
$177.25 (recent breakout zone, now first line of support)
$170.96 (gap-fill + mid-channel support)
$167.33 (critical higher-low level)
Below this, $164.65 and $154.14 are major swing supports.
- Resistance Levels:
$180.51 (near-term resistance; previous high rejection area)
Break and hold above $181.91 could open the path toward $188–$190.
- Momentum (RSI 58.44):
RSI has cooled off from overbought conditions in July.
Currently trending higher but not yet extended, leaving room for continuation.
*Bullish Scenario: A daily close above $181.91 would confirm breakout continuation, targeting $188–$190 near channel resistance.
*Bearish Scenario: Failure to hold $177.25 risks a pullback toward $171–167, where trend support and buyers are likely to step in.
Disclaimer: I am not a financial advisor. The information shared here is for educational and informational purposes only and should not be considered financial advice. Always do your own research and consult with a licensed financial professional before making investment decisions.
면책사항
해당 정보와 게시물은 금융, 투자, 트레이딩 또는 기타 유형의 조언이나 권장 사항으로 간주되지 않으며, 트레이딩뷰에서 제공하거나 보증하는 것이 아닙니다. 자세한 내용은 이용 약관을 참조하세요.
면책사항
해당 정보와 게시물은 금융, 투자, 트레이딩 또는 기타 유형의 조언이나 권장 사항으로 간주되지 않으며, 트레이딩뷰에서 제공하거나 보증하는 것이 아닙니다. 자세한 내용은 이용 약관을 참조하세요.