📉 NVIDIA Daily Chart Correction – Elliott Wave Insight
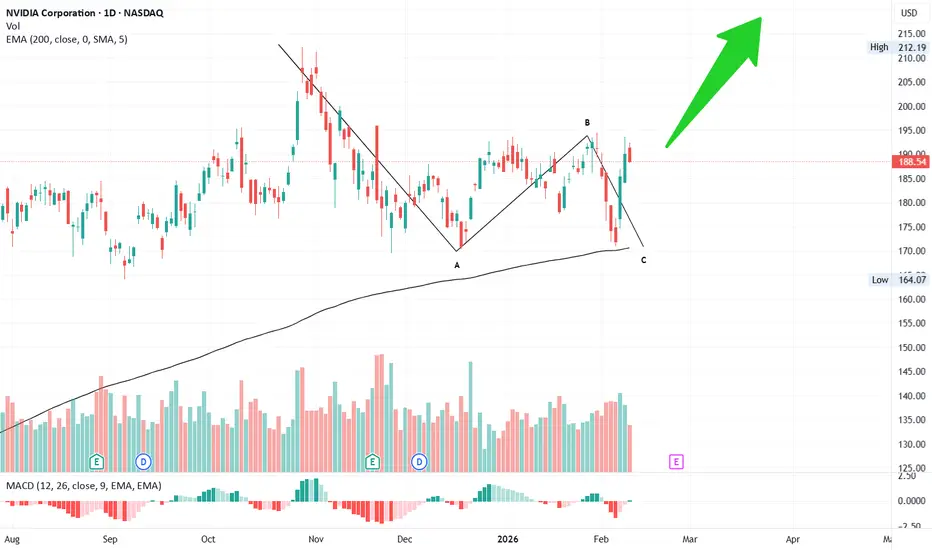
NVIDIA began its correction on 29 Oct ’25, topping at 212. From there, it declined sharply to 170 by 17 Dec ’25, completing the A wave.
📊 The A wave unfolded in 5 sub-waves, signaling a zig-zag correction pattern.
📈 As expected, the B wave retraced less than the 61.8% Fibonacci level, peaking at 197 on 29 Jan ’26.
💥 The C wave followed with a sharp downfall, finally completing on 5 Feb ’26 right at the 200 EMA on the daily chart.
🎯 Looking ahead, the next target sits at 220, aligning with the broader corrective structure and Fibonacci projections.
⚡ This sequence highlights the precision of Elliott Wave theory in capturing market psychology and corrective structures.
#Trading 📉 #ElliottWave 📊 #NVIDIA 💹 #TechnicalAnalysis 📈 #StockMarketInsights 💵 #Target 🎯 #Stocks 📊 #Investing 💼 #Charts 🖊️ #MarketTrends 📊
관련 발행물
면책사항
해당 정보와 게시물은 금융, 투자, 트레이딩 또는 기타 유형의 조언이나 권장 사항으로 간주되지 않으며, 트레이딩뷰에서 제공하거나 보증하는 것이 아닙니다. 자세한 내용은 이용 약관을 참조하세요.
면책사항
해당 정보와 게시물은 금융, 투자, 트레이딩 또는 기타 유형의 조언이나 권장 사항으로 간주되지 않으며, 트레이딩뷰에서 제공하거나 보증하는 것이 아닙니다. 자세한 내용은 이용 약관을 참조하세요.