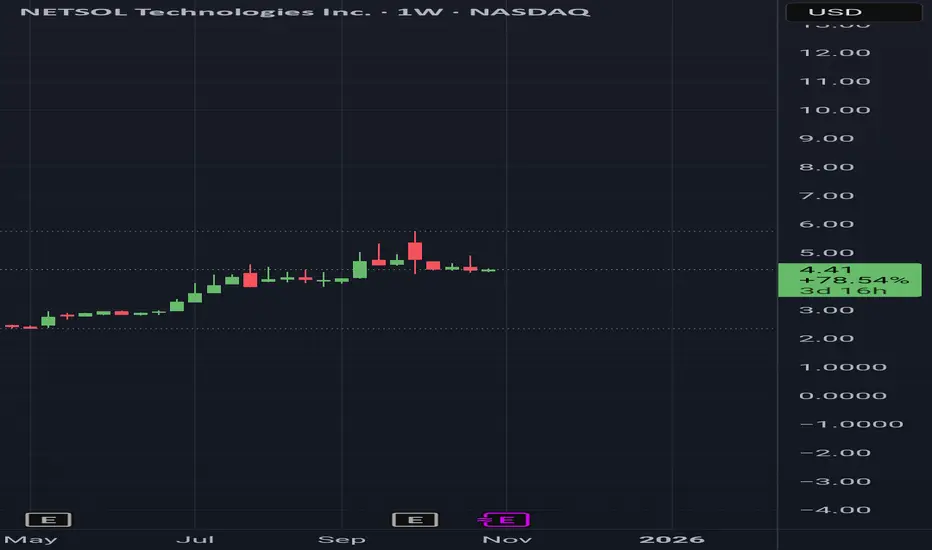
NETSOL TECHNOLOGY (NASDAQ)
The yearly pattern has been bullish since January, this pattern is very important, if it breaks, a new one will likely develop around 2029, (No support found).
The half yearly pattern has been bullish since January 2024, with one support noted at $2.15.
The quarterly pattern is almost bullish, the next green quarterly candle will indicate a bullish trend, above $5.80, the structure will remains bullish, (No support found).
The monthly pattern will be bullish in December, January, two supports are noted at $2.40 and $2.09.
The weekly pattern is bullish but at the wrong place, another weekly bullish pattern needs to form, three supports are noted at $4.00, $2.96, and $2.26.
If the yearly pattern stays bullish, the above resistances are noted to be tested at $7.00, $10.00, $11.40, $15.20, and it could likely reach $27.60.
The quarterly resistances are noted to be tested at $10.10, $11.70, and $20.00.
The monthly major resistances are noted to be tested at $12.10, $21.60, and $23.00.
The weekly resistances are noted to be tested at $6.61, $10.53, $13.74, $20.30, and $58.60.
Overall, bearish market supports are noted at $1.52 and $1.17.
Disclaimer, This message is for educational purposes only,
Always DYOR,
Note, TradingView doesn't allow me to share my technical analysis chart,
면책사항
이 정보와 게시물은 TradingView에서 제공하거나 보증하는 금융, 투자, 거래 또는 기타 유형의 조언이나 권고 사항을 의미하거나 구성하지 않습니다. 자세한 내용은 이용 약관을 참고하세요.
면책사항
이 정보와 게시물은 TradingView에서 제공하거나 보증하는 금융, 투자, 거래 또는 기타 유형의 조언이나 권고 사항을 의미하거나 구성하지 않습니다. 자세한 내용은 이용 약관을 참고하세요.