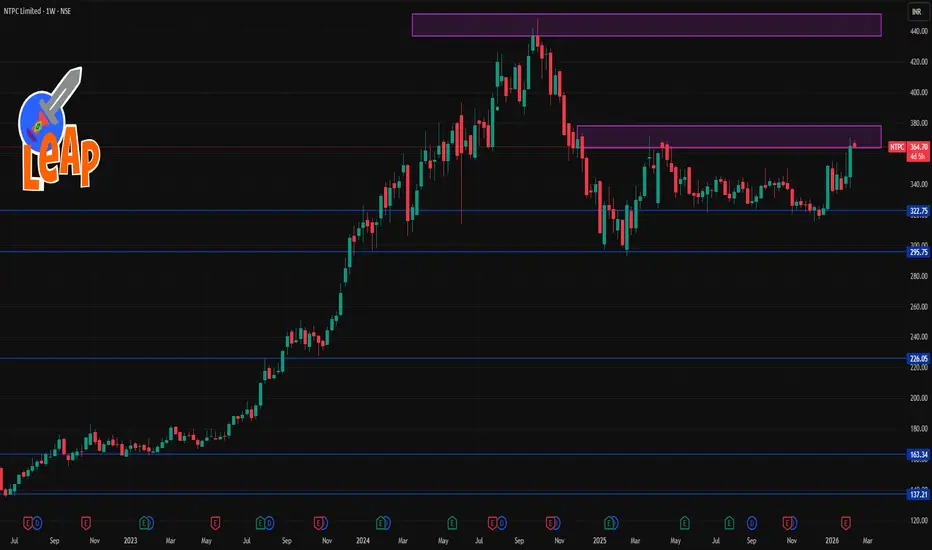
📊 Current Approx Price Range
• Trading near ₹365–₹370 on the NSE this week.
📈 Weekly Resistance Levels (Upside)
• R1: ~₹378 – first reaction resistance this week
• R2: ~₹390 – secondary hurdle before fresh upside
• R3: ~₹410 – extended resistance if bulls dominate
• Fibonacci/Weekly Pivot R2–R3: ~₹390–₹411 area
📉 Weekly Support Levels (Downside)
• S1: ~₹345 – first major weekly support zone
• S2: ~₹325 – deeper support if S1 breaks
• S3: ~₹312 – last weekly structure support
• Weekly Pivot/Fib S1 area: ~₹324–₹345
📌 Weekly Pivot Approx Levels (from pivot calculations)
• Standard weekly pivots place pivot ~₹357–₹358, with support/resistance branching around it.
📊 Technical Signals (Weekly)
• Some platforms show a bullish/“strong buy” bias based on weekly indicators (moving averages & oscillators) — suggesting the trend is currently positive if the price holds above key supports.
Quick summary:
➡️ Bullish week if NTPC holds above ₹345 and breaks above ₹378–₹390.
➡️ Bearish pressure if weekly close slips below ₹345 → ₹325 → ₹312.
관련 발행물
면책사항
해당 정보와 게시물은 금융, 투자, 트레이딩 또는 기타 유형의 조언이나 권장 사항으로 간주되지 않으며, 트레이딩뷰에서 제공하거나 보증하는 것이 아닙니다. 자세한 내용은 이용 약관을 참조하세요.
관련 발행물
면책사항
해당 정보와 게시물은 금융, 투자, 트레이딩 또는 기타 유형의 조언이나 권장 사항으로 간주되지 않으며, 트레이딩뷰에서 제공하거나 보증하는 것이 아닙니다. 자세한 내용은 이용 약관을 참조하세요.