See Chart
노트
meant to label as a short액티브 트레이드
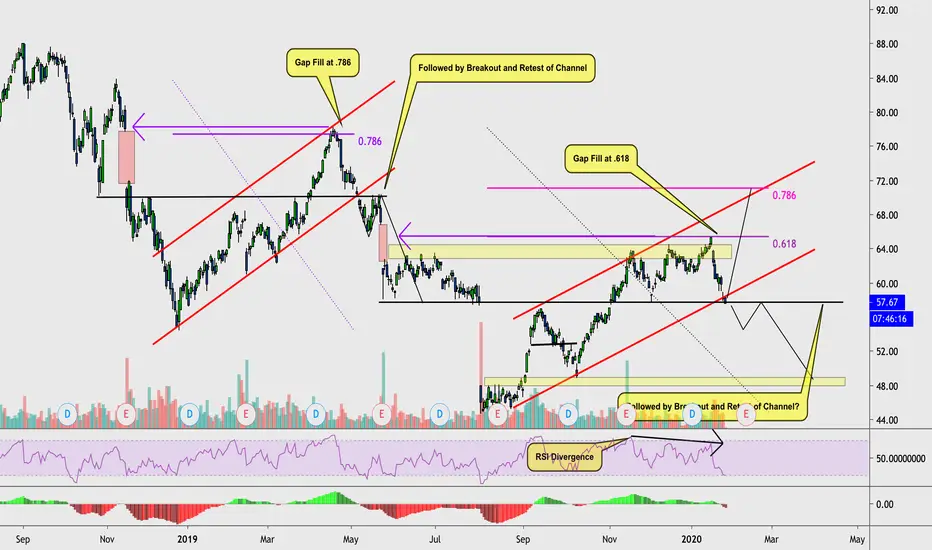
Price made the forecasted bearish breakout and is currently retesting the broken $58 structure as resistance just as it did back between 16-24 of May 2019. This provides us with an interesting pattern that follows historical price action. Will be looking to enter short if structure holds.노트
Price is moving perfectly according to plan! 면책사항
이 정보와 게시물은 TradingView에서 제공하거나 보증하는 금융, 투자, 거래 또는 기타 유형의 조언이나 권고 사항을 의미하거나 구성하지 않습니다. 자세한 내용은 이용 약관을 참고하세요.
면책사항
이 정보와 게시물은 TradingView에서 제공하거나 보증하는 금융, 투자, 거래 또는 기타 유형의 조언이나 권고 사항을 의미하거나 구성하지 않습니다. 자세한 내용은 이용 약관을 참고하세요.