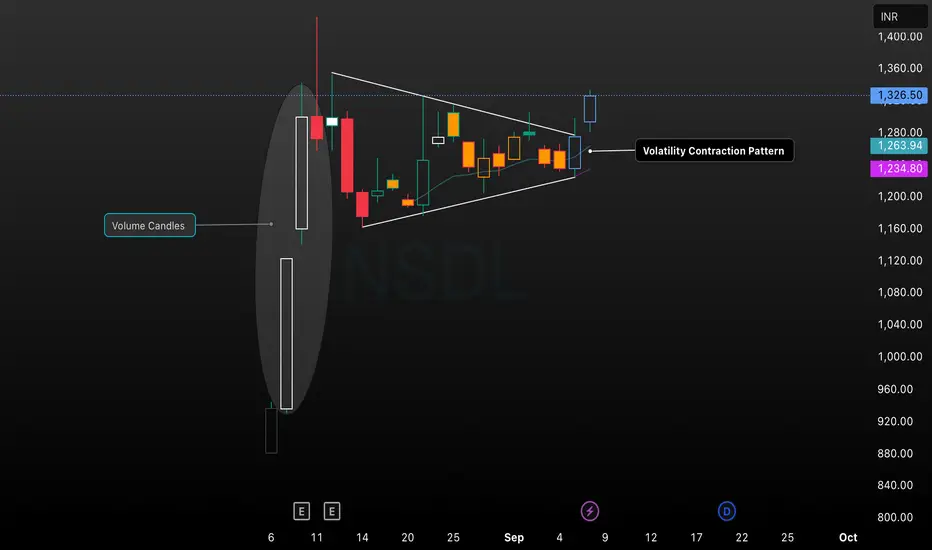
This chart displays the NSDL stock price on a daily timeframe, featuring a classic Volatility Contraction Pattern (VCP) after a surge in volume and price. The consolidation phase is marked by converging trendlines, with price contracting and forming tighter ranges. The recent breakout above the upper trendline signals renewed bullish momentum. Volume candles accentuate the initial surge, and key support/resistance levels are noted. This technical setup is ideal for traders seeking entries based on volatility contraction and breakout strategies.
면책사항
이 정보와 게시물은 TradingView에서 제공하거나 보증하는 금융, 투자, 거래 또는 기타 유형의 조언이나 권고 사항을 의미하거나 구성하지 않습니다. 자세한 내용은 이용 약관을 참고하세요.
면책사항
이 정보와 게시물은 TradingView에서 제공하거나 보증하는 금융, 투자, 거래 또는 기타 유형의 조언이나 권고 사항을 의미하거나 구성하지 않습니다. 자세한 내용은 이용 약관을 참고하세요.