NSDL Breakout from Symmetrical Triangle – Possible Upside Move
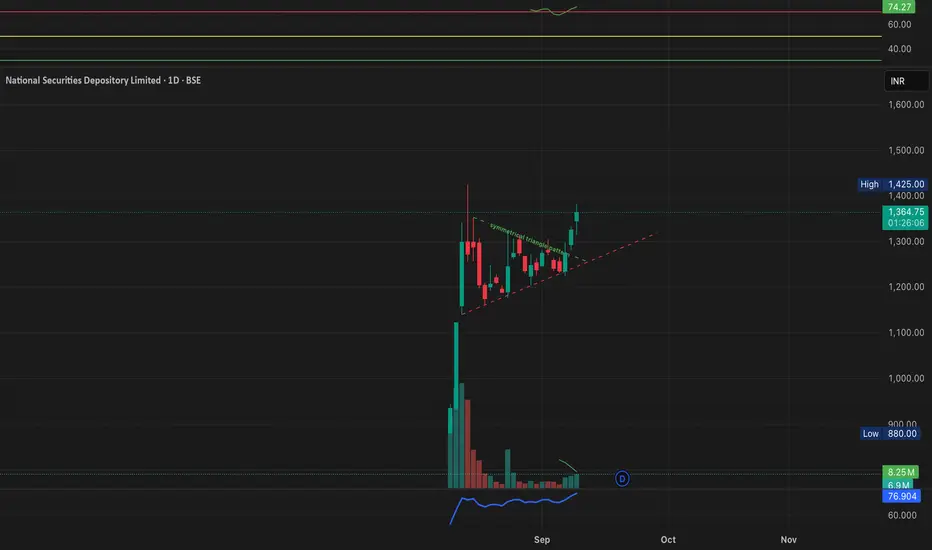
The chart shows the stock price of National Securities Depository Limited (NSDL) listed on BSE. A symmetrical triangle pattern has formed over the past few sessions, with converging trendlines indicating consolidation. Today, the stock has broken above the upper trendline on higher volume, signaling a potential bullish breakout.
Key Observations:
Price has moved above the resistance trendline of the symmetrical triangle.
Volume is increasing, which confirms buying interest.
RSI is above 70, indicating strong momentum, though it may also suggest overbought conditions.
The next resistance level is near ₹1,425.
This breakout suggests a bullish move in the near term, but traders should monitor for confirmation and manage risk.
ANALYSIS BY MAYUR JAYANT TAKALIKAR -- FOR LEARNING & OBSERVATIONAL USE ONLY.
⚠ Disclaimer:
I am not SEBI registered and this is not financial advice. This is purely an educational analysis based on chart patterns. Please consult a qualified financial advisor before making any investment decisions.
면책사항
이 정보와 게시물은 TradingView에서 제공하거나 보증하는 금융, 투자, 거래 또는 기타 유형의 조언이나 권고 사항을 의미하거나 구성하지 않습니다. 자세한 내용은 이용 약관을 참고하세요.
면책사항
이 정보와 게시물은 TradingView에서 제공하거나 보증하는 금융, 투자, 거래 또는 기타 유형의 조언이나 권고 사항을 의미하거나 구성하지 않습니다. 자세한 내용은 이용 약관을 참고하세요.