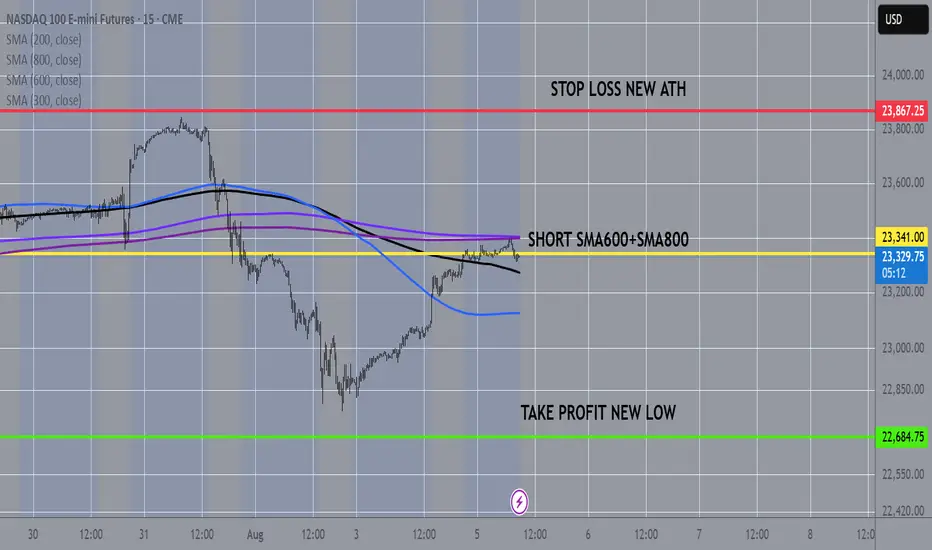
Nasdaq100 at 10 and 15min chart touches the sma600 and the sma800 so as in many other cases before, odds are are more that it will fall from here to a new low
면책사항
이 정보와 게시물은 TradingView에서 제공하거나 보증하는 금융, 투자, 거래 또는 기타 유형의 조언이나 권고 사항을 의미하거나 구성하지 않습니다. 자세한 내용은 이용 약관을 참고하세요.
면책사항
이 정보와 게시물은 TradingView에서 제공하거나 보증하는 금융, 투자, 거래 또는 기타 유형의 조언이나 권고 사항을 의미하거나 구성하지 않습니다. 자세한 내용은 이용 약관을 참고하세요.