Key Indicators On Trade Set Up In General
1. Push Set Up
2. Range Set Up
3. Break & Retest Set Up
Notes On Session
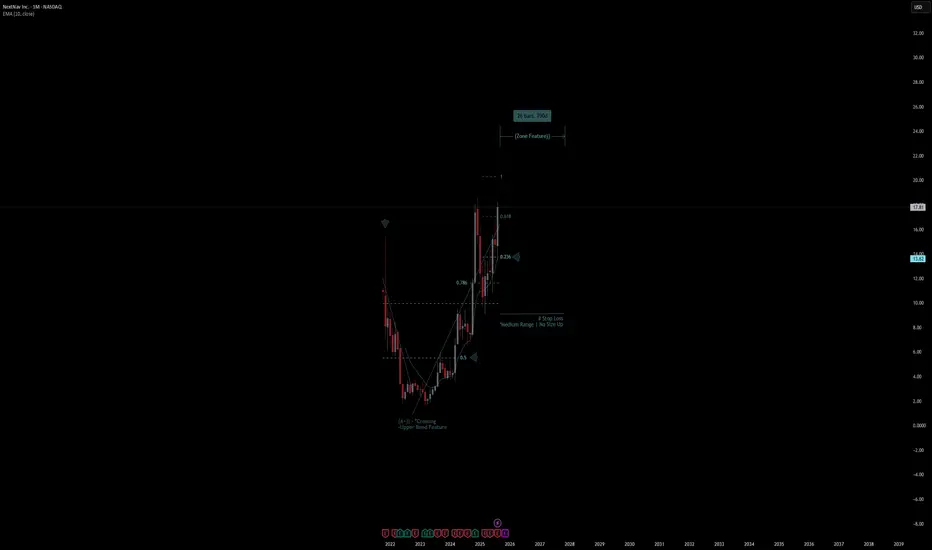
# NextNav Inc.
- Double Formation
* (A+)) - *Crossing - *10EMA - Long Entry | Subdivision 1
* (Medium Range)) | No Size Up - *1.5RR | Completed Survey
* 20 bars, 608d | Date Range Method - *Uptrend Argument))
- Triple Formation
* (P1)) / (P2)) & (P3)) | Subdivision 2
* Monthly Time Frame | Trend Settings Condition | Subdivision 3
- (Hypothesis On Entry Bias)) | Regular Settings
* Stop Loss Feature Varies Regarding To Main Entry And Can Occur Unevenly
- Position On A 1.5RR
* Stop Loss At 12.00 USD
* Entry At 15.00 USD
* Take Profit At 20.00 USD
* (Uptrend Argument)) & No Pattern Confirmation
- Continuation Pattern | Not Valid
- Reversal Pattern | Not Valid
* Ongoing Entry & (Neutral Area))
Active Sessions On Relevant Range & Elemented Probabilities;
European-Session(Upwards) - East Coast-Session(Downwards) - Asian-Session(Ranging)
Conclusion | Trade Plan Execution & Risk Management On Demand;
Overall Consensus | Buy
1. Push Set Up
2. Range Set Up
3. Break & Retest Set Up
Notes On Session
# NextNav Inc.
- Double Formation
* (A+)) - *Crossing - *10EMA - Long Entry | Subdivision 1
* (Medium Range)) | No Size Up - *1.5RR | Completed Survey
* 20 bars, 608d | Date Range Method - *Uptrend Argument))
- Triple Formation
* (P1)) / (P2)) & (P3)) | Subdivision 2
* Monthly Time Frame | Trend Settings Condition | Subdivision 3
- (Hypothesis On Entry Bias)) | Regular Settings
* Stop Loss Feature Varies Regarding To Main Entry And Can Occur Unevenly
- Position On A 1.5RR
* Stop Loss At 12.00 USD
* Entry At 15.00 USD
* Take Profit At 20.00 USD
* (Uptrend Argument)) & No Pattern Confirmation
- Continuation Pattern | Not Valid
- Reversal Pattern | Not Valid
* Ongoing Entry & (Neutral Area))
Active Sessions On Relevant Range & Elemented Probabilities;
European-Session(Upwards) - East Coast-Session(Downwards) - Asian-Session(Ranging)
Conclusion | Trade Plan Execution & Risk Management On Demand;
Overall Consensus | Buy
면책사항
이 정보와 게시물은 TradingView에서 제공하거나 보증하는 금융, 투자, 거래 또는 기타 유형의 조언이나 권고 사항을 의미하거나 구성하지 않습니다. 자세한 내용은 이용 약관을 참고하세요.
면책사항
이 정보와 게시물은 TradingView에서 제공하거나 보증하는 금융, 투자, 거래 또는 기타 유형의 조언이나 권고 사항을 의미하거나 구성하지 않습니다. 자세한 내용은 이용 약관을 참고하세요.