📊 Current Context
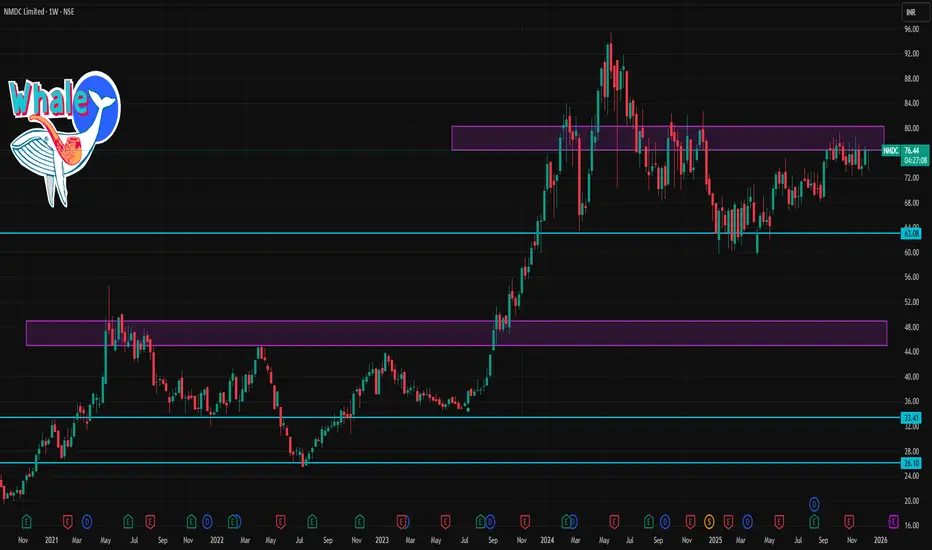
The stock is trading around ~₹74–76 recently.
🧠 Notes for the Week
Bullish scenario: Holding above ₹76 could support a move toward ₹78–80.
Bearish scenario: If price closes weekly below ₹73–72, short‑term downside may extend toward ₹71.
Pivot levels and Fibonacci retracements suggest the midpoint resistance ~₹75–76 is key for the next few sessions.
🔎 Quick Summary (1‑Week Levels)
Level Type Zone (Approx)
Strong Support ₹71–72
Immediate Support ₹73–74
Weekly Pivot ₹75.5–76
Immediate Resistance ₹76–77
Higher Resistance ₹78–79
Breakout Zone ₹80+
관련 발행물
면책사항
해당 정보와 게시물은 금융, 투자, 트레이딩 또는 기타 유형의 조언이나 권장 사항으로 간주되지 않으며, 트레이딩뷰에서 제공하거나 보증하는 것이 아닙니다. 자세한 내용은 이용 약관을 참조하세요.
관련 발행물
면책사항
해당 정보와 게시물은 금융, 투자, 트레이딩 또는 기타 유형의 조언이나 권장 사항으로 간주되지 않으며, 트레이딩뷰에서 제공하거나 보증하는 것이 아닙니다. 자세한 내용은 이용 약관을 참조하세요.