Price Action
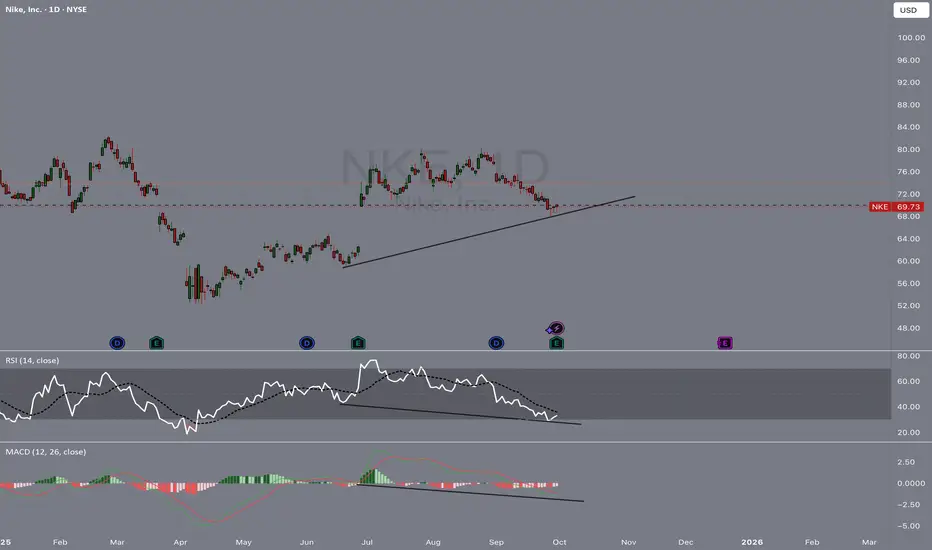
- NKE has been in a downtrend, recently pulling back to trendline support around $69–$70.
- Price is testing this support zone, which aligns with prior structure.
Support & Resistance
- Key support: $69–$70 (trendline + horizontal level)
- Resistance: $73–$75 (recent breakdown zone)
RSI (Relative Strength Index)
- RSI (14) in a downtrend but showing bullish divergence (higher lows vs price making lower lows)
- Suggests potential bounce from oversold territory.
MACD (Moving Average Convergence Divergence)
- MACD is deeply negative but flattening.
- Potential for a momentum shift if buyers step in.
Overall Setup
- NKE is sitting on critical support with bullish divergence on RSI!
- Bounce toward $73–$75 possible if support holds!
- Breakdown below $69 could open downside toward $65!
면책사항
이 정보와 게시물은 TradingView에서 제공하거나 보증하는 금융, 투자, 거래 또는 기타 유형의 조언이나 권고 사항을 의미하거나 구성하지 않습니다. 자세한 내용은 이용 약관을 참고하세요.
면책사항
이 정보와 게시물은 TradingView에서 제공하거나 보증하는 금융, 투자, 거래 또는 기타 유형의 조언이나 권고 사항을 의미하거나 구성하지 않습니다. 자세한 내용은 이용 약관을 참고하세요.