As of May 9, 2025, the Nifty Midcap Select Index is exhibiting a mildly bullish trend on the 4-hour timeframe, supported by various technical indicators and pivot point analyses.
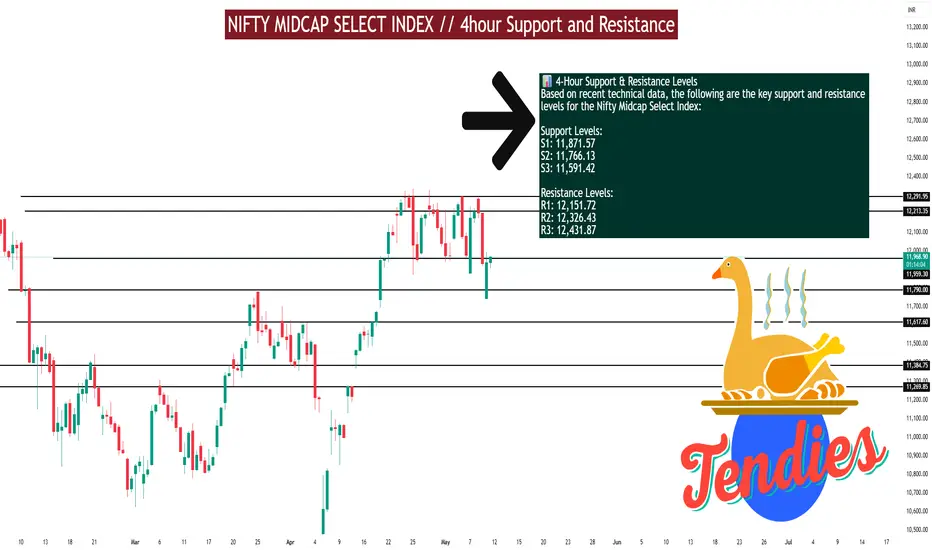
📊 4-Hour Support & Resistance Levels
Based on recent technical data, the following are the key support and resistance levels for the Nifty Midcap Select Index:
Support Levels:
S1: 11,871.57
S2: 11,766.13
S3: 11,591.42
Resistance Levels:
R1: 12,151.72
R2: 12,326.43
R3: 12,431.87
🔍 Technical Indicators (4-Hour Timeframe)
Relative Strength Index (RSI): 74.96 – approaching overbought territory, suggesting potential for a short-term pullback.
Moving Average Convergence Divergence (MACD): 250.27 – indicates bullish momentum.
Average Directional Index (ADX): 25.11 – signifies a strengthening trend.
Stochastic Oscillator: 96.87 – overbought condition, caution advised.
Supertrend Indicator: Positioned at 11,824.56 – currently acting as a support level.
Parabolic SAR: 11,733.42 – below the current price, reinforcing the bullish stance.
📈 Trend Analysis
The index is trading above its 5-period and 15-period simple moving averages on the 4-hour chart, indicating a mild bullish crossover. This suggests continued upward momentum in the near term.
⚠️ Trading Insights
Bullish Scenario: A sustained move above 12,151.72 could open the path toward 12,326.43 and potentially 12,431.87.
Bearish Scenario: Failure to hold above 11,871.57 may lead to a retest of 11,766.13 or even 11,591.42.
I built a Buy & Sell Signal Indicator with 85% accuracy.
📈 Get access via DM or
WhatsApp: wa.link/d997q0
| Email: techncialexpress@gmail.com
| Script Coder | Trader | Investor | From India
📈 Get access via DM or
WhatsApp: wa.link/d997q0
| Email: techncialexpress@gmail.com
| Script Coder | Trader | Investor | From India
관련 발행물
면책사항
이 정보와 게시물은 TradingView에서 제공하거나 보증하는 금융, 투자, 거래 또는 기타 유형의 조언이나 권고 사항을 의미하거나 구성하지 않습니다. 자세한 내용은 이용 약관을 참고하세요.