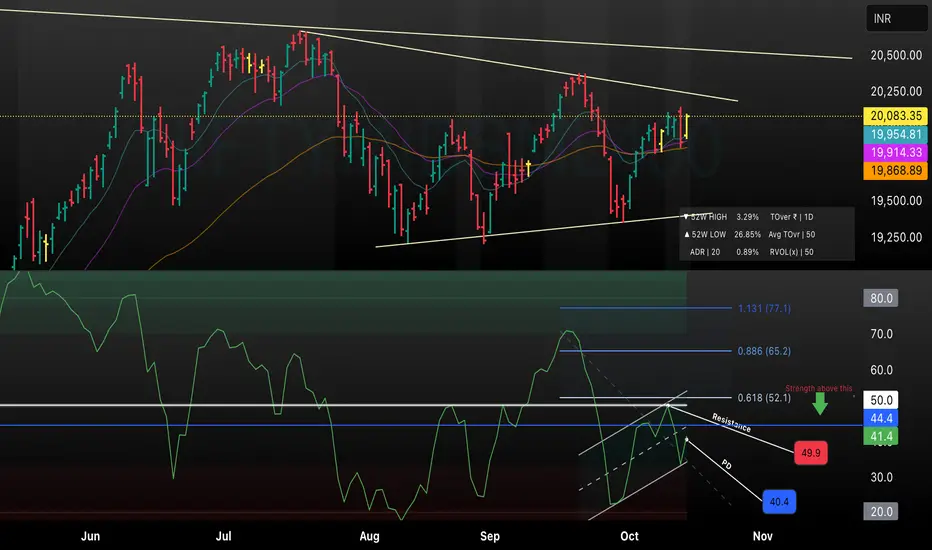
This chart replaces the RSI indicator with a market breadth analysis, offering a broader view of participation across Nifty 50 components. The lower panel now plots a key market breadth indicator such as the Advance-Decline Line or the percentage of stocks trading above key moving averages, highlighting the overall health of the index. An uptick in breadth (broad participation) near resistance lines would strengthen the bullish thesis, while weakening breadth at key levels may warn of impending reversals. This updated setup combines price channel structure, moving averages, and market breadth metrics for more robust, actionable trading decisions.
면책사항
해당 정보와 게시물은 금융, 투자, 트레이딩 또는 기타 유형의 조언이나 권장 사항으로 간주되지 않으며, 트레이딩뷰에서 제공하거나 보증하는 것이 아닙니다. 자세한 내용은 이용 약관을 참조하세요.
면책사항
해당 정보와 게시물은 금융, 투자, 트레이딩 또는 기타 유형의 조언이나 권장 사항으로 간주되지 않으며, 트레이딩뷰에서 제공하거나 보증하는 것이 아닙니다. 자세한 내용은 이용 약관을 참조하세요.