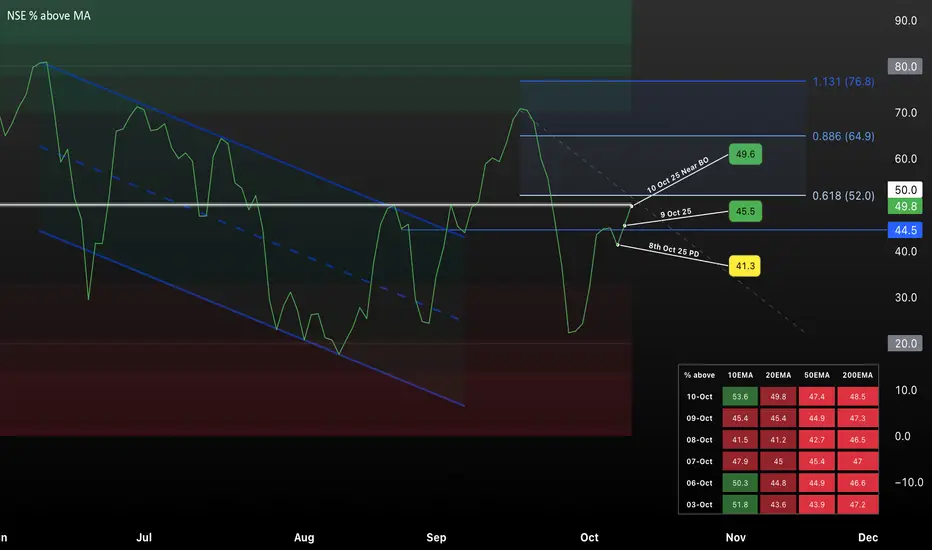
This TradingView chart visualizes the percentage of NSE stocks trading above key moving averages (10EMA, 20EMA, 50EMA, 200EMA) over recent months, highlighting a potential breakout zone as of October 2025. Key price levels (41.3, 44.5, 45.5, 49.6) are marked, with Fibonacci retracement zones indicating possible resistance and support. The chart showcases prior downtrend, recent recovery, and stalled momentum around the 50 level, making it a useful reference for market breadth and trend strength analysis for short-term trading strategies.
면책사항
해당 정보와 게시물은 금융, 투자, 트레이딩 또는 기타 유형의 조언이나 권장 사항으로 간주되지 않으며, 트레이딩뷰에서 제공하거나 보증하는 것이 아닙니다. 자세한 내용은 이용 약관을 참조하세요.
면책사항
해당 정보와 게시물은 금융, 투자, 트레이딩 또는 기타 유형의 조언이나 권장 사항으로 간주되지 않으며, 트레이딩뷰에서 제공하거나 보증하는 것이 아닙니다. 자세한 내용은 이용 약관을 참조하세요.