Annotations Patterns:
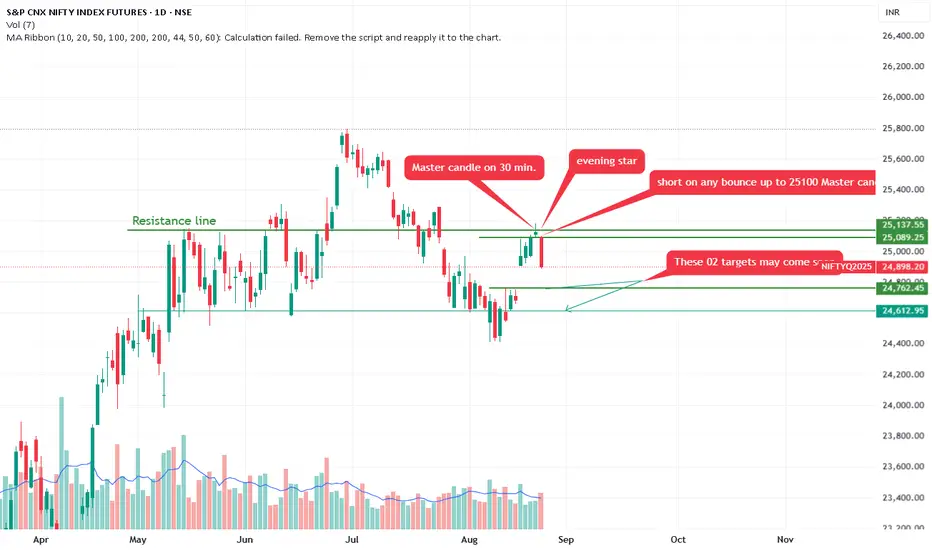
Master Candle on 30 min. Evening Star: Points to the recent high. A "master candle" refers to a large-range candle (here, likely on a 30-minute timeframe) that encompasses subsequent smaller candles, Combined with an "evening star" pattern—a three-candle bearish reversal (large green candle, small-bodied doji/star, followed by a large red candle closing below the first's midpoint)—this suggests a topping formation and potential for further downside.
Short on Any Bounce Up to 25,000-25,100 Master Candle Low.
Recommends selling (shorting) if price rebounds to 25,000-25,100 (labeled as the master candle's low, acting as resistance on pullback).
These 02 Targets May Come Soon: Arrows to lower levels (~24,793 and possibly 24,613), implying quick downside targets.
A downward-sloping green trendline projects further decline.
Overall Trend: The chart depicts a bull market correction or potential reversal. After months of gains, momentum has shifted bearish, with price breaking below key supports (e.g., the green line at 25,137). Higher volume on declines reinforces this.
The chart's creator appears to have a bearish bias, focusing on reversal patterns and downside projections.
액티브 트레이드
Nifty crashhhh.........Target-1 24,777 done.
면책사항
이 정보와 게시물은 TradingView에서 제공하거나 보증하는 금융, 투자, 거래 또는 기타 유형의 조언이나 권고 사항을 의미하거나 구성하지 않습니다. 자세한 내용은 이용 약관을 참고하세요.
면책사항
이 정보와 게시물은 TradingView에서 제공하거나 보증하는 금융, 투자, 거래 또는 기타 유형의 조언이나 권고 사항을 의미하거나 구성하지 않습니다. 자세한 내용은 이용 약관을 참고하세요.