1. Technical Levels — Weekly Pivot Points & Fibonacci Zones
Thanks to TopStockResearch, here are the key pivot-derived levels for the weekly timeframe:
Standard Weekly Pivots:
Support 2 (S2): ~24,213.80
Support 1 (S1): ~24,000.80
Pivot (Central): ~24,830.70
Resistance 1 (R1): ~25,234.60
Resistance 2 (R2): ~25,447.60
Fibonacci Weekly Levels:
S2: ~24,236.46
Pivot: ~24,617.70
R1: ~24,853.36
R2: ~24,998.94
R3: ~25,234.60
Summary of horizontal price zones (support / resistance):
Support zones: 24,000 – 24,213
Pivot zone: 24,617 – 24,830
Resistance zones: 24,853 – 25,447
Additional Important Levels from Analysts & Market Reports
Consumers, Tariffs & Volatility
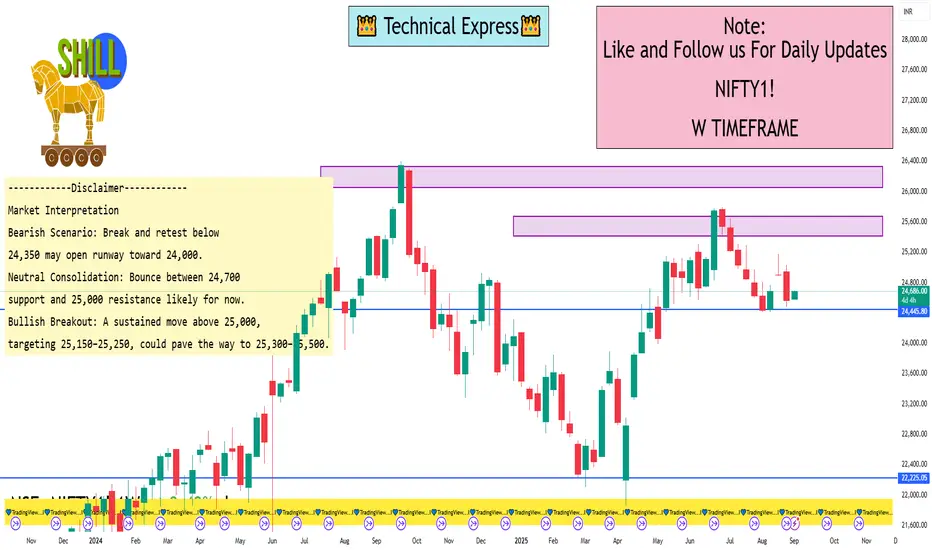
Analysts warn that a breakdown below 24,350 may trigger more selling pressure.
Previous Week’s Support
As of late August 2025, 24,250 has been identified as a critical support level.
Strong Support Around 24,700
Analysts indicated that there’s robust support near 24,700. A breakout above 25,150 could pave the way toward 25,300–25,500, while a dip below 24,800 might drag the index down to around 24,600.
Expected Trading Range
Market experts suggest that in the near term, the Nifty may oscillate between 24,200 and 24,800, with the 200-day exponential moving average (DEMA) acting as support around 24,200.
Thanks to TopStockResearch, here are the key pivot-derived levels for the weekly timeframe:
Standard Weekly Pivots:
Support 2 (S2): ~24,213.80
Support 1 (S1): ~24,000.80
Pivot (Central): ~24,830.70
Resistance 1 (R1): ~25,234.60
Resistance 2 (R2): ~25,447.60
Fibonacci Weekly Levels:
S2: ~24,236.46
Pivot: ~24,617.70
R1: ~24,853.36
R2: ~24,998.94
R3: ~25,234.60
Summary of horizontal price zones (support / resistance):
Support zones: 24,000 – 24,213
Pivot zone: 24,617 – 24,830
Resistance zones: 24,853 – 25,447
Additional Important Levels from Analysts & Market Reports
Consumers, Tariffs & Volatility
Analysts warn that a breakdown below 24,350 may trigger more selling pressure.
Previous Week’s Support
As of late August 2025, 24,250 has been identified as a critical support level.
Strong Support Around 24,700
Analysts indicated that there’s robust support near 24,700. A breakout above 25,150 could pave the way toward 25,300–25,500, while a dip below 24,800 might drag the index down to around 24,600.
Expected Trading Range
Market experts suggest that in the near term, the Nifty may oscillate between 24,200 and 24,800, with the 200-day exponential moving average (DEMA) acting as support around 24,200.
I built a Buy & Sell Signal Indicator with 85% accuracy.
📈 Get access via DM or
WhatsApp: wa.link/d997q0
Contact - +91 76782 40962
| Email: techncialexpress@gmail.com
| Script Coder | Trader | Investor | From India
📈 Get access via DM or
WhatsApp: wa.link/d997q0
Contact - +91 76782 40962
| Email: techncialexpress@gmail.com
| Script Coder | Trader | Investor | From India
관련 발행물
면책사항
해당 정보와 게시물은 금융, 투자, 트레이딩 또는 기타 유형의 조언이나 권장 사항으로 간주되지 않으며, 트레이딩뷰에서 제공하거나 보증하는 것이 아닙니다. 자세한 내용은 이용 약관을 참조하세요.