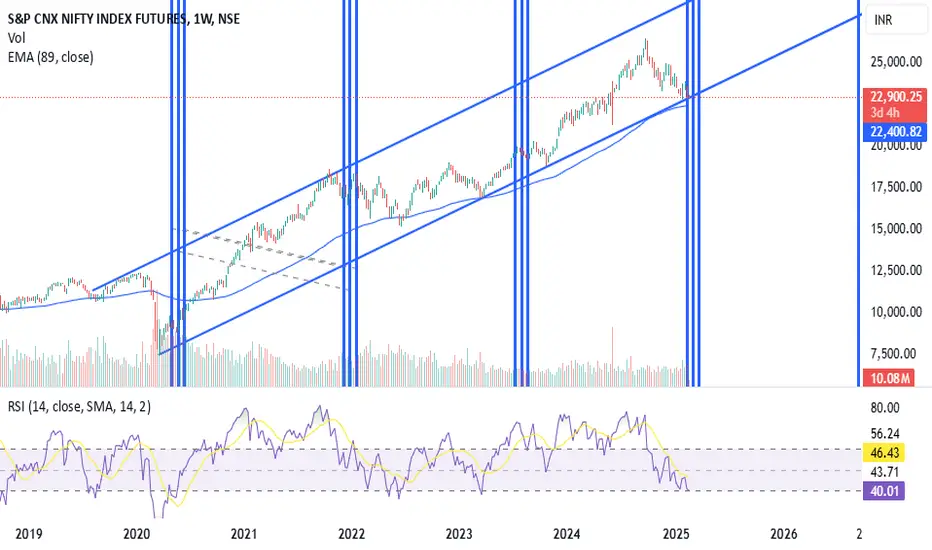
As seen on weekly charts of nifty it has entered a time-cycle zone and multiple supports are in this zone. A trend-line on weekly chart, Weekly moving average, monthly mid of bollinger band or 20 SMA and a bullish time-cycle zone all these supports are in the range of 22200-22800.
A close above a previous day high will show 1st signs of reversal and close above weekly high will confirm the reversal.
Investing partially will be recommended at current levels.
A close above a previous day high will show 1st signs of reversal and close above weekly high will confirm the reversal.
Investing partially will be recommended at current levels.
면책사항
이 정보와 게시물은 TradingView에서 제공하거나 보증하는 금융, 투자, 거래 또는 기타 유형의 조언이나 권고 사항을 의미하거나 구성하지 않습니다. 자세한 내용은 이용 약관을 참고하세요.
면책사항
이 정보와 게시물은 TradingView에서 제공하거나 보증하는 금융, 투자, 거래 또는 기타 유형의 조언이나 권고 사항을 의미하거나 구성하지 않습니다. 자세한 내용은 이용 약관을 참고하세요.