📅 NIFTY Trading Plan – 20th May 2025
🕒 Timeframe: 15-Minute | 🎯 Strategy Focus: Price Reaction Zones + Structure-Based Trading + Psychological Triggers
📌 Key Zones to Watch:
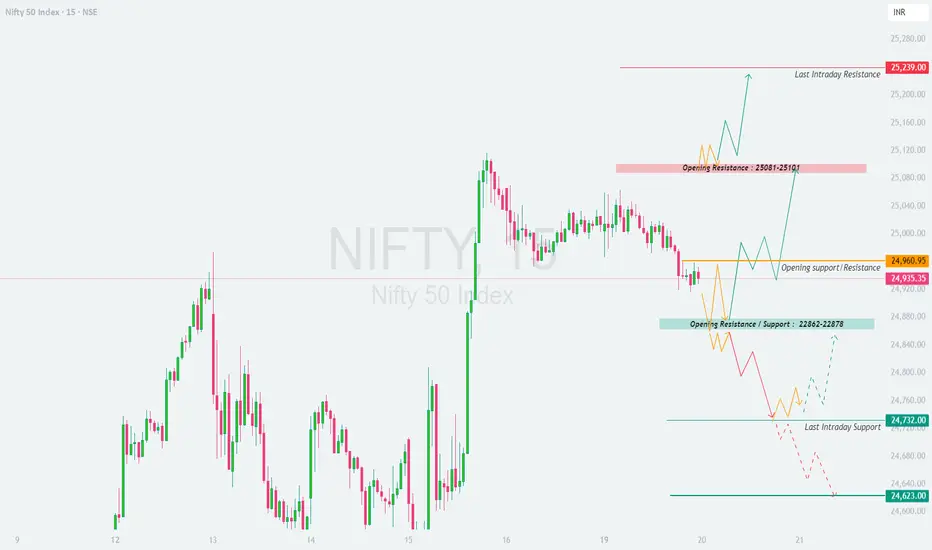
🔴 Resistance Zone: 25,081 – 25,101
🟠 Opening Pivot Zone: 24,960 – 24,980
🟦 Initial Support/Resistance: 24,862 – 24,878
🟢 Last Intraday Support: 24,732
🟢 Final Breakdown Support: 24,623
🔺 Last Intraday Resistance: 25,239
📈 Scenario 1: GAP UP Opening (🔺 100+ points) – Opening Above 25,050
If Nifty opens with a strong gap-up directly into or above the resistance zone 25,081 – 25,101, it enters a supply zone from where reversals have occurred in the past.
📌 Educational Note: A gap-up into resistance is a liquidity magnet. Always seek candle confirmation before acting. Momentum traders should only participate if the breakout sustains with strength.
⚖️ Scenario 2: FLAT Opening (Within ±100 points) – Between 24,860 – 24,980
This scenario offers the most balanced opportunity to trade both sides, depending on where price moves post-opening.
📌 Educational Note: Flat opens are where the market seeks direction. Don’t trade the first candle — observe whether buyers or sellers dominate before committing capital.
📉 Scenario 3: GAP DOWN Opening (🔻 100+ points) – Opening Below 24,860
A gap-down below the initial support zone 24,862–24,878 sets a bearish tone, but it can trap emotional sellers if not confirmed.
📌 Educational Note: Gap-downs often trigger panic. Smart traders stay calm and react only when price gives clean structure — don’t bottom fish unless a reversal structure appears.
🛡️ Options Trading – Risk Management Tips:
✅ Respect the Premium Decay: Avoid buying far OTM options on Tuesday unless there's strong momentum confirmation.
✅ Set SL as a % of Premium: Use a 30–40% SL of premium for long option positions.
✅ Hedge Naked Options: If selling options, always hedge using defined-risk spreads.
✅ Use Time-Decaying Strategies: Calendar spreads or neutral plays work better in choppy zones.
✅ Position Sizing is Key: Don’t risk more than 1–2% of capital per trade — it protects your mental capital too.
✅ Avoid Holding Naked Positions Overnight: Carry only if hedged or directional clarity is backed by event data.
📊 Summary & Conclusion:
🔼 Above 25,101: Bullish momentum likely → Target 25,180 – 25,239
🔄 Between 24,862 – 24,980: Neutral zone → Wait for breakout or breakdown
🔽 Below 24,862: Bearish tone → Target 24,732 – 24,623 on confirmation
📌 Key Lesson: Let price confirm the move. React, don’t predict. Level-based action always wins over emotions.
📢 Disclaimer:
I am not a SEBI-registered analyst. The above content is shared purely for educational and informational purposes. Please consult your financial advisor or do your own research before taking any trades.
🕒 Timeframe: 15-Minute | 🎯 Strategy Focus: Price Reaction Zones + Structure-Based Trading + Psychological Triggers
📌 Key Zones to Watch:
🔴 Resistance Zone: 25,081 – 25,101
🟠 Opening Pivot Zone: 24,960 – 24,980
🟦 Initial Support/Resistance: 24,862 – 24,878
🟢 Last Intraday Support: 24,732
🟢 Final Breakdown Support: 24,623
🔺 Last Intraday Resistance: 25,239
📈 Scenario 1: GAP UP Opening (🔺 100+ points) – Opening Above 25,050
If Nifty opens with a strong gap-up directly into or above the resistance zone 25,081 – 25,101, it enters a supply zone from where reversals have occurred in the past.
- []Avoid rushing into long trades immediately after a gap-up.
[]Wait for a 15-minute candle close above 25,101 with strong follow-up buying volume to confirm breakout strength.
[]On confirmation, expect targets toward 25,180 → 25,239 (last intraday resistance).
[]However, if price gets rejected from the resistance zone with upper wicks or bearish engulfing candles, then short trades toward 24,980 → 24,960 become favorable. - A failed breakout from this level often leads to a short-trap liquidation move.
📌 Educational Note: A gap-up into resistance is a liquidity magnet. Always seek candle confirmation before acting. Momentum traders should only participate if the breakout sustains with strength.
⚖️ Scenario 2: FLAT Opening (Within ±100 points) – Between 24,860 – 24,980
This scenario offers the most balanced opportunity to trade both sides, depending on where price moves post-opening.
- []If price sustains above 24,980 for 15–30 minutes, a breakout attempt toward 25,081 → 25,101 is likely.
[]A clear break and close above 25,101 may trigger long trades aiming for 25,180 → 25,239.
[]On the downside, if price fails to hold above 24,960 and breaks below 24,878, a slide toward 24,732 → 24,623 can unfold.
[]For rangebound movement, you may consider deploying neutral strategies like Iron Fly or ATM straddle with tight SLs.
📌 Educational Note: Flat opens are where the market seeks direction. Don’t trade the first candle — observe whether buyers or sellers dominate before committing capital.
📉 Scenario 3: GAP DOWN Opening (🔻 100+ points) – Opening Below 24,860
A gap-down below the initial support zone 24,862–24,878 sets a bearish tone, but it can trap emotional sellers if not confirmed.
- []If the price opens near 24,840–24,860 and shows early signs of holding, a short-covering move back to 24,960 is possible.
[]However, if price breaches below 24,732 (last intraday support), the index could slide further toward 24,623.
[]Avoid buying blindly just because it's a gap-down — instead, wait for a reversal confirmation (hammer, morning star).
[]Momentum traders can go short below 24,732 with SL above 24,780, targeting 24,650 – 24,623.
📌 Educational Note: Gap-downs often trigger panic. Smart traders stay calm and react only when price gives clean structure — don’t bottom fish unless a reversal structure appears.
🛡️ Options Trading – Risk Management Tips:
✅ Respect the Premium Decay: Avoid buying far OTM options on Tuesday unless there's strong momentum confirmation.
✅ Set SL as a % of Premium: Use a 30–40% SL of premium for long option positions.
✅ Hedge Naked Options: If selling options, always hedge using defined-risk spreads.
✅ Use Time-Decaying Strategies: Calendar spreads or neutral plays work better in choppy zones.
✅ Position Sizing is Key: Don’t risk more than 1–2% of capital per trade — it protects your mental capital too.
✅ Avoid Holding Naked Positions Overnight: Carry only if hedged or directional clarity is backed by event data.
📊 Summary & Conclusion:
🔼 Above 25,101: Bullish momentum likely → Target 25,180 – 25,239
🔄 Between 24,862 – 24,980: Neutral zone → Wait for breakout or breakdown
🔽 Below 24,862: Bearish tone → Target 24,732 – 24,623 on confirmation
📌 Key Lesson: Let price confirm the move. React, don’t predict. Level-based action always wins over emotions.
📢 Disclaimer:
I am not a SEBI-registered analyst. The above content is shared purely for educational and informational purposes. Please consult your financial advisor or do your own research before taking any trades.
면책사항
이 정보와 게시물은 TradingView에서 제공하거나 보증하는 금융, 투자, 거래 또는 기타 유형의 조언이나 권고 사항을 의미하거나 구성하지 않습니다. 자세한 내용은 이용 약관을 참고하세요.
면책사항
이 정보와 게시물은 TradingView에서 제공하거나 보증하는 금융, 투자, 거래 또는 기타 유형의 조언이나 권고 사항을 의미하거나 구성하지 않습니다. 자세한 내용은 이용 약관을 참고하세요.