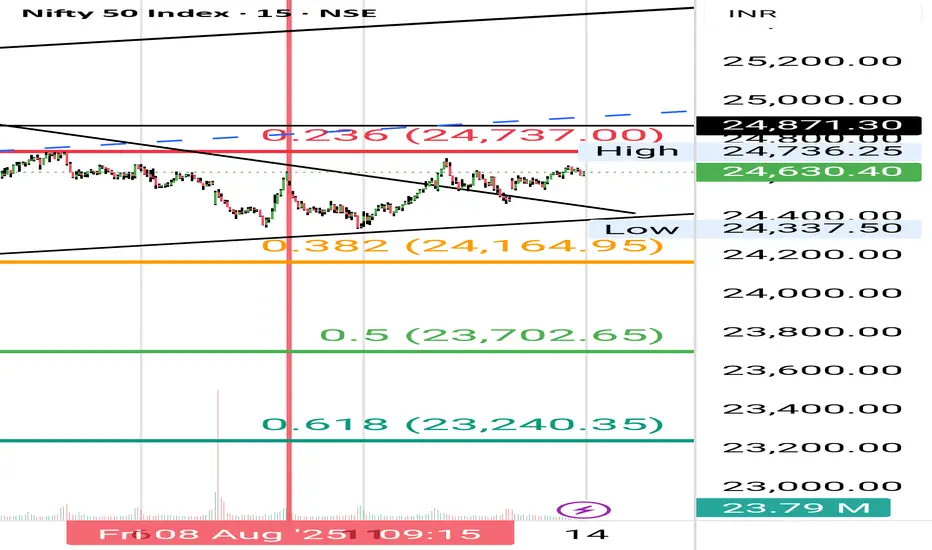
The Nifty 50 is currently consolidating within a well-defined range of 24,300 (support) to 24,700 (resistance). This compression zone is backed by strong Open Interest clustering on both Call and Put sides, suggesting a potential breakout setup. My idea focuses on visualizing this range with floating entry labels, CE/PE overlays, and mutually exclusive signal logic to guide intraday decisions.
---
🔍 Technical Setup
| Parameter | Value / Observation |
|----------------------|------------------------------------------------|
| Support Zone | 24,300–24,400 |
| Resistance Zone | 24,700–24,740 |
| Daily RSI | Positive crossover, holding above 50 |
| Candlestick Signal | Inverted hammer + long upper shadows |
| OI Clustering | Highest Call & Put OI at 24,500 |
| EMA Structure | Price hovering near 10-day and 50-day EMA |
Bullish Breakout Plan
- Trigger: Sustained close above 24,740
- Target Zones: 24,900 → 25,200
- Entry Label: Floating CE overlay with momentum confirmation
- Stop-loss: Below 24,480
🔸 Bearish Breakdown Plan
- Trigger: Breach below 24,300
- Target Zones: 24,100 → 23,950
- Entry Label: PE overlay with RSI divergence confirmation
- Stop-loss: Above 24,450
면책사항
이 정보와 게시물은 TradingView에서 제공하거나 보증하는 금융, 투자, 거래 또는 기타 유형의 조언이나 권고 사항을 의미하거나 구성하지 않습니다. 자세한 내용은 이용 약관을 참고하세요.
면책사항
이 정보와 게시물은 TradingView에서 제공하거나 보증하는 금융, 투자, 거래 또는 기타 유형의 조언이나 권고 사항을 의미하거나 구성하지 않습니다. 자세한 내용은 이용 약관을 참고하세요.