📅 NIFTY 50 Trading Plan – 19th May 2025
⏰ Timeframe: 15-Minute | 🧠 Approach: Actionable, Risk-Reward Based, Psychological Zones
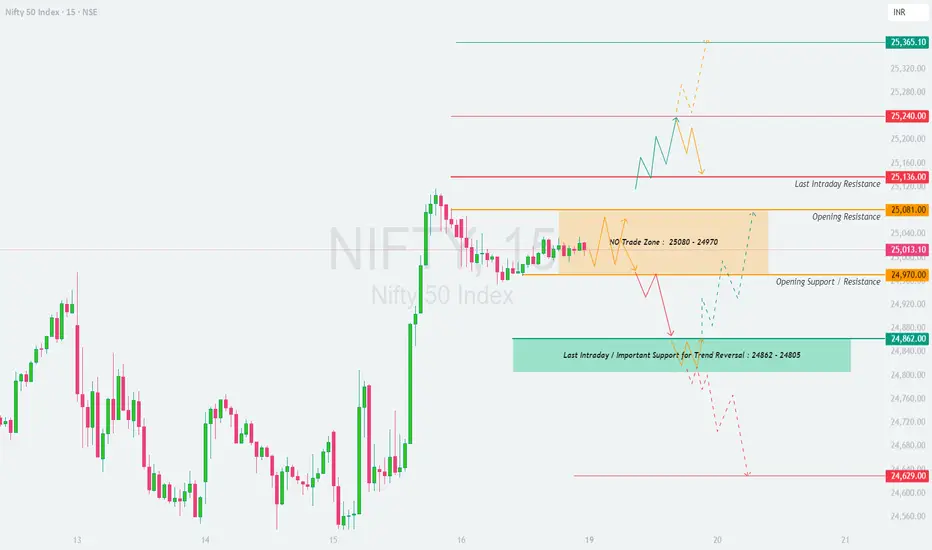
📍 Chart Key Levels:
🔸 No Trade Zone: 25,080 – 24,970
🟥 Opening Resistance: 25,081
🟧 Opening Support / Resistance: 24,970
🟩 Strong Support Zone: 24,862 – 24,805
🟥 Last Intraday Resistance: 25,136
🔺 Target/ATH Zone: 25,240 → 25,365
🟥 Breakdown Zone: Below 24,862 leads to weakness with next support at 24,629
📈 Scenario 1: GAP UP Opening (100+ Points Up) – Above 25,136 🚀
If Nifty opens with a gap-up above 25,136, prices will already be near or inside the resistance zone. Avoid chasing trades at open.
📌 Educational Note: When the market opens in a resistance zone, let it settle for the first 15–30 minutes to avoid false breakouts.
📉 Scenario 2: FLAT Opening (within 50 pts of previous close) – Inside No Trade Zone (24,970–25,080) 🔄
Opening in this range creates confusion. This zone is best avoided for fresh trades unless a breakout/breakdown is confirmed.
📌 Educational Note: No Trade Zones often result in whipsaw moves – stay disciplined and wait for clean direction.
📉 Scenario 3: GAP DOWN Opening (100+ Points Down) – Below 24,862 ⚠️
If the market opens below the key support zone of 24,862, sentiment turns bearish.
📌 Educational Note: Strong support zones can lead to high risk-reward reversal trades if combined with proper price action.
💡 Options Trading – Risk Management Tips:
🛡️ Always hedge directional positions when holding beyond intraday.
⏳ Avoid buying options when IV is high, especially after gap-ups.
💰 Use defined SLs like hourly candle closes to avoid panic exits.
📉 If trading breakout with options, consider buying near the money for better delta impact.
📊 Summary:
✅ Above 25,240 = bullish continuation zone
⚠️ 25,081 – 24,970 = No Trade Zone
🔻 Below 24,862 = Trend reversal or fresh weakness
Wait for first 15–30 min candle to confirm trade direction. Avoid emotional entries and focus on clean breakout or reversal confirmation patterns.
📢 Disclaimer:
I am not a SEBI-registered analyst. All views shared are for educational purposes only. Please do your own research or consult with a financial advisor before taking any trades.
⏰ Timeframe: 15-Minute | 🧠 Approach: Actionable, Risk-Reward Based, Psychological Zones
📍 Chart Key Levels:
🔸 No Trade Zone: 25,080 – 24,970
🟥 Opening Resistance: 25,081
🟧 Opening Support / Resistance: 24,970
🟩 Strong Support Zone: 24,862 – 24,805
🟥 Last Intraday Resistance: 25,136
🔺 Target/ATH Zone: 25,240 → 25,365
🟥 Breakdown Zone: Below 24,862 leads to weakness with next support at 24,629
📈 Scenario 1: GAP UP Opening (100+ Points Up) – Above 25,136 🚀
If Nifty opens with a gap-up above 25,136, prices will already be near or inside the resistance zone. Avoid chasing trades at open.
- []Wait for a 15-min candle to close above 25,240. This confirms strength and opens the way toward the ATH zone of 25,365+.
[]Book profits gradually near ATH zone, and expect possible selling pressure here. - If price fails to sustain above 25,240, avoid fresh longs and look for rejection patterns (like bearish engulfing) for quick intraday shorts back to 25,136.
📌 Educational Note: When the market opens in a resistance zone, let it settle for the first 15–30 minutes to avoid false breakouts.
📉 Scenario 2: FLAT Opening (within 50 pts of previous close) – Inside No Trade Zone (24,970–25,080) 🔄
Opening in this range creates confusion. This zone is best avoided for fresh trades unless a breakout/breakdown is confirmed.
- []If price breaks above 25,081 with strong bullish momentum, you may consider a long entry targeting 25,136 → 25,240.
[]If price breaks down below 24,970, you can initiate short positions with target toward 24,862 → 24,805. - Avoid any position inside the orange zone until one side is clearly broken.
📌 Educational Note: No Trade Zones often result in whipsaw moves – stay disciplined and wait for clean direction.
📉 Scenario 3: GAP DOWN Opening (100+ Points Down) – Below 24,862 ⚠️
If the market opens below the key support zone of 24,862, sentiment turns bearish.
- []Look for follow-through selling below 24,805 to target 24,629.
[]However, any bounce-back from 24,805–24,862 zone with volume confirmation can be used for intraday reversal trades back to 24,970. - Wait for a proper rejection candle or bullish engulfing pattern before taking reversal long trades.
📌 Educational Note: Strong support zones can lead to high risk-reward reversal trades if combined with proper price action.
💡 Options Trading – Risk Management Tips:
🛡️ Always hedge directional positions when holding beyond intraday.
⏳ Avoid buying options when IV is high, especially after gap-ups.
💰 Use defined SLs like hourly candle closes to avoid panic exits.
📉 If trading breakout with options, consider buying near the money for better delta impact.
📊 Summary:
✅ Above 25,240 = bullish continuation zone
⚠️ 25,081 – 24,970 = No Trade Zone
🔻 Below 24,862 = Trend reversal or fresh weakness
Wait for first 15–30 min candle to confirm trade direction. Avoid emotional entries and focus on clean breakout or reversal confirmation patterns.
📢 Disclaimer:
I am not a SEBI-registered analyst. All views shared are for educational purposes only. Please do your own research or consult with a financial advisor before taking any trades.
면책사항
해당 정보와 게시물은 금융, 투자, 트레이딩 또는 기타 유형의 조언이나 권장 사항으로 간주되지 않으며, 트레이딩뷰에서 제공하거나 보증하는 것이 아닙니다. 자세한 내용은 이용 약관을 참조하세요.
면책사항
해당 정보와 게시물은 금융, 투자, 트레이딩 또는 기타 유형의 조언이나 권장 사항으로 간주되지 않으며, 트레이딩뷰에서 제공하거나 보증하는 것이 아닙니다. 자세한 내용은 이용 약관을 참조하세요.