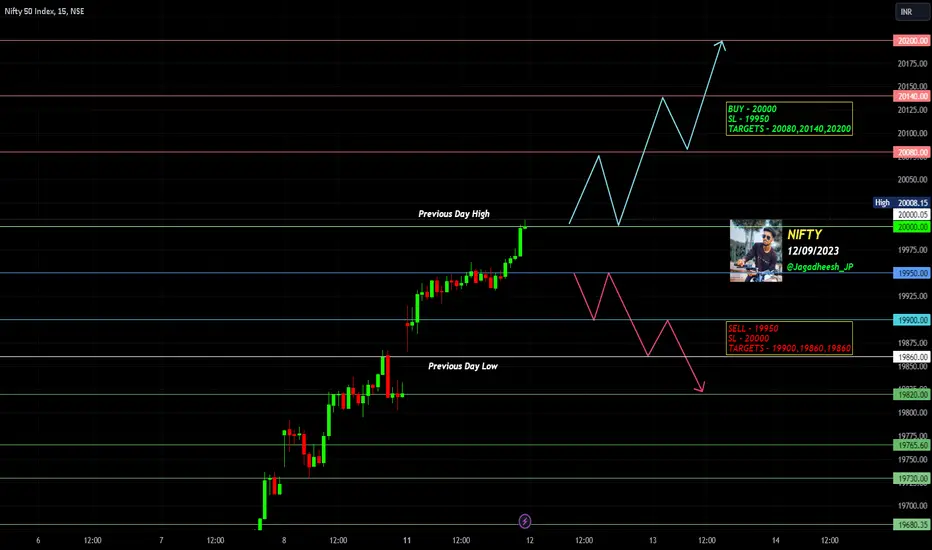
BUY ABOVE - 20000
SL - 19950
TARGETS - 20080,20140,20200
SELL BELOW - 19950
SL - 20000
TARGETS - 19900,19860,19860
Previous Day High - 20008
Previous Day Low - 19860
I am sharing NIFTY levels this levels acts as important support & resistance for intraday. if you want to trade with this levels wait for 15 min Candle closing above that levels. You can trade with breakout and reversal both.
In this channel, I share my expertise in trading strategies, technical analysis, and market trends to help you make informed decisions in your trading ventures.
Stay tuned for daily updates, in-depth market analyses, and real-time trading scenarios to witness firsthand how we transform from Zero to Hero in the trading world. My Only aim is to empower you with the knowledge and skills necessary to navigate the complexities of the financial markets successfully.
Based on price action major support & resistance's are here, the red lines acts as resistances, the green lines acts as supports. If the price breaks the support/resistance, it will move to the next support/resistance line. White lines indicates previous day high & low, high acts as a resistance & low acts as a support for next day.
Please NOTE: this levels are for intraday trading only.
Disclaimer - All information on this page is for educational purposes only,
we are not SEBI Registered, Please consult a SEBI registered financial advisor for your financial matters before investing And taking any decision. We are not responsible for any profit/loss you made.
Request your support and engagement by liking and commenting & follow to provide encouragement
HAPPY TRADING 👍
노트
Nifty opened Huge gapup of 113.80(0.57%) points액티브 트레이드
Buy side trade activated enter with minimum quantity safe traders avoid
매매 수동청산
EXIT WITH NO LOSS NO PROFIT노트
Because of fibonacci retracement it will going down노트
Thank you very much to all 4000+ supporters now we are 4000+ family 🤝
관련 발행물
면책사항
해당 정보와 게시물은 금융, 투자, 트레이딩 또는 기타 유형의 조언이나 권장 사항으로 간주되지 않으며, 트레이딩뷰에서 제공하거나 보증하는 것이 아닙니다. 자세한 내용은 이용 약관을 참조하세요.
관련 발행물
면책사항
해당 정보와 게시물은 금융, 투자, 트레이딩 또는 기타 유형의 조언이나 권장 사항으로 간주되지 않으며, 트레이딩뷰에서 제공하거나 보증하는 것이 아닙니다. 자세한 내용은 이용 약관을 참조하세요.