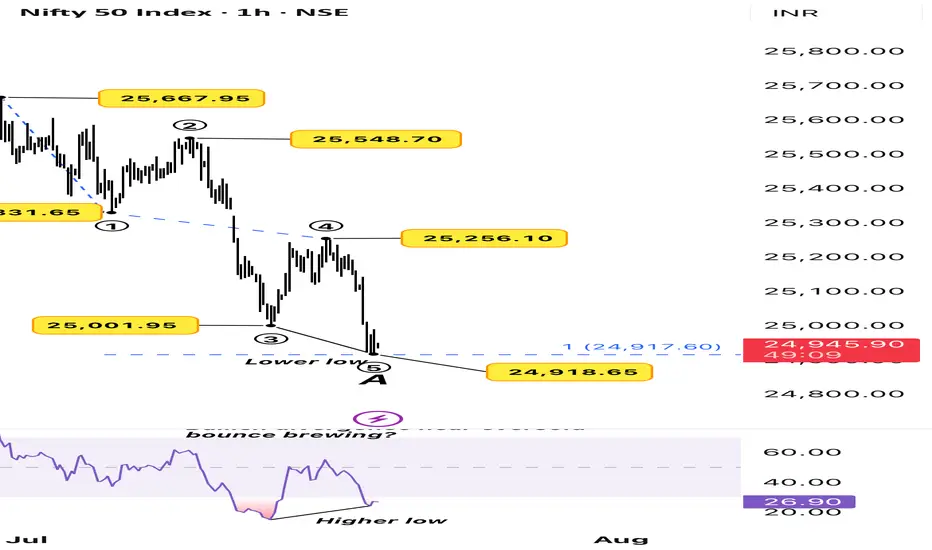
The Nifty 50 has completed a 5-wave impulse on the 1-hour timeframe, with Wave ⑤ tagging a fresh lower low at 24,918, just under the previous swing.
While price made a lower low, RSI made a higher low, forming a bullish divergence just above the oversold zone. This often indicates weakening bearish momentum and a potential for a short-term bounce or a larger correction depending on the context.
We now have:
• ✅ A completed 5-wave(wave A) decline
• ✅ Price at a key support zone
• ✅ RSI divergence adding confluence
If this structure holds, we may have completed wave A and be entering Wave B of correction.
Disclaimer: This analysis is for educational purposes only and does not constitute investment advice. Please do your own research (DYOR) before making any trading decisions.
WaveXplorer | Elliott Wave insights
📊 X profile: @veerappa89
📊 X profile: @veerappa89
면책사항
해당 정보와 게시물은 금융, 투자, 트레이딩 또는 기타 유형의 조언이나 권장 사항으로 간주되지 않으며, 트레이딩뷰에서 제공하거나 보증하는 것이 아닙니다. 자세한 내용은 이용 약관을 참조하세요.
WaveXplorer | Elliott Wave insights
📊 X profile: @veerappa89
📊 X profile: @veerappa89
면책사항
해당 정보와 게시물은 금융, 투자, 트레이딩 또는 기타 유형의 조언이나 권장 사항으로 간주되지 않으며, 트레이딩뷰에서 제공하거나 보증하는 것이 아닙니다. 자세한 내용은 이용 약관을 참조하세요.