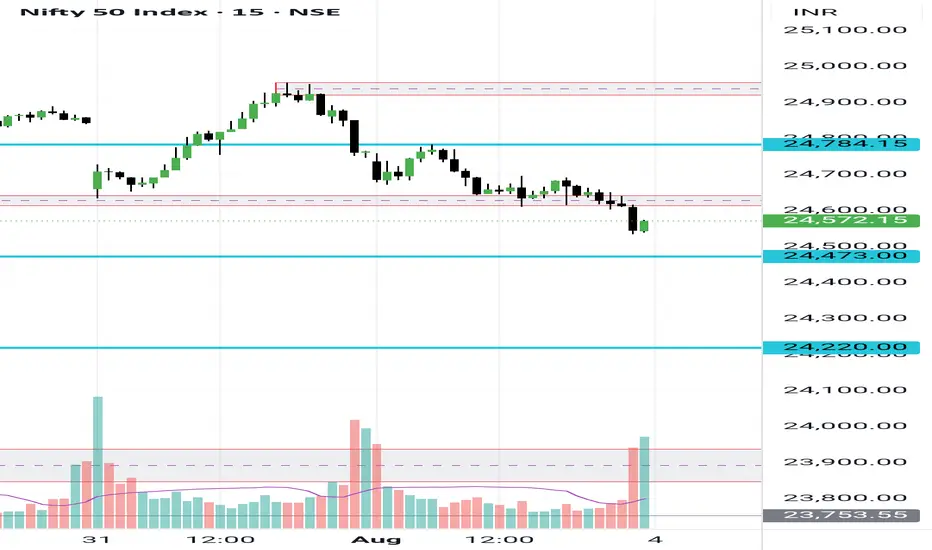
Nifty is in a clear downtrend, important levels are marked on the chart.
A break below 24550 may bring the 24460 level and a break further may show the 24300 levels too on the chart. It may not be seen in a single day but can be visible in few trading sessions.
An up move is possible only above 24630 level that too if price sustains above this level else it may bring more selling from upper levels..
Let's see how it turns out..
노트
On the close of the Week (4th to 8th August) - the Story of the week is Nifty opens on 4th August around 24610, makes high around 24740, and from there it falls sharp 400 points during the week. And where it reaches? - What I have mentioned in the analysis - the 24300 zone - Friday 8th August Closing is 24335.면책사항
이 정보와 게시물은 TradingView에서 제공하거나 보증하는 금융, 투자, 거래 또는 기타 유형의 조언이나 권고 사항을 의미하거나 구성하지 않습니다. 자세한 내용은 이용 약관을 참고하세요.
면책사항
이 정보와 게시물은 TradingView에서 제공하거나 보증하는 금융, 투자, 거래 또는 기타 유형의 조언이나 권고 사항을 의미하거나 구성하지 않습니다. 자세한 내용은 이용 약관을 참고하세요.