📈 Chart Structure Overview
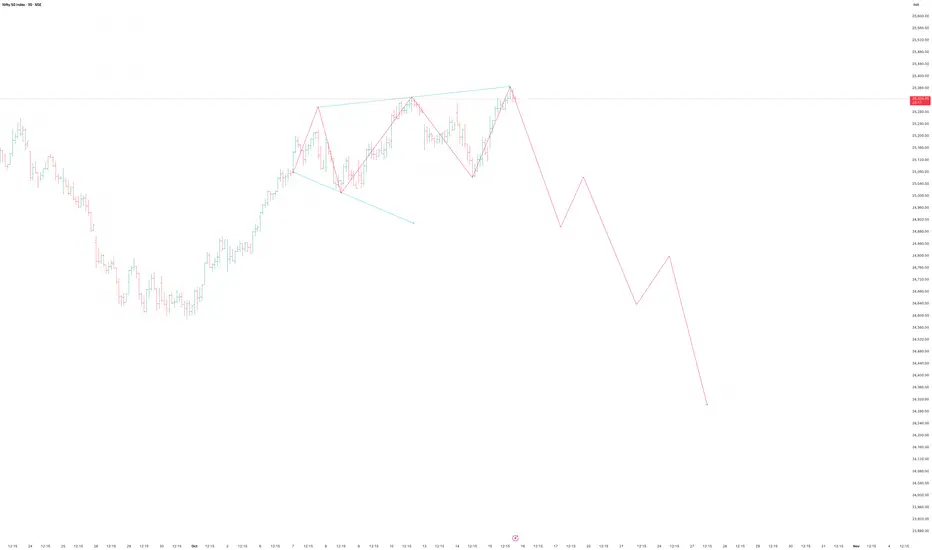
The chart clearly shows a rising wedge formation — a bearish reversal pattern typically appearing at the end of a bullish rally.
✅ Summary View
Aspect Observation
Pattern Rising Wedge (Bearish)
Bias Short-term corrective / bearish
Key Resistance 25,380–25,420
Key Breakdown Zone 25,120
Targets 24,900 → 24,700 → 24,400
Stop-loss (for short) 25,450
Conclusion
Nifty’s price action suggests distribution and exhaustion at the top.
A confirmed breakdown below 25,120 could open up a short-term correction of 500–700 points.
Stay cautious of false breakouts above 25,400 unless backed by strong volume.
Disclaimer:
This analysis is for educational and technical insight purposes only.
Trading decisions should be based on your own confirmation strategy, volume validation, and risk management.
액티브 트레이드
노트
Fall from here is impulsive. 면책사항
이 정보와 게시물은 TradingView에서 제공하거나 보증하는 금융, 투자, 거래 또는 기타 유형의 조언이나 권고 사항을 의미하거나 구성하지 않습니다. 자세한 내용은 이용 약관을 참고하세요.
면책사항
이 정보와 게시물은 TradingView에서 제공하거나 보증하는 금융, 투자, 거래 또는 기타 유형의 조언이나 권고 사항을 의미하거나 구성하지 않습니다. 자세한 내용은 이용 약관을 참고하세요.