In previous chart, Expected upsurge accomplished:

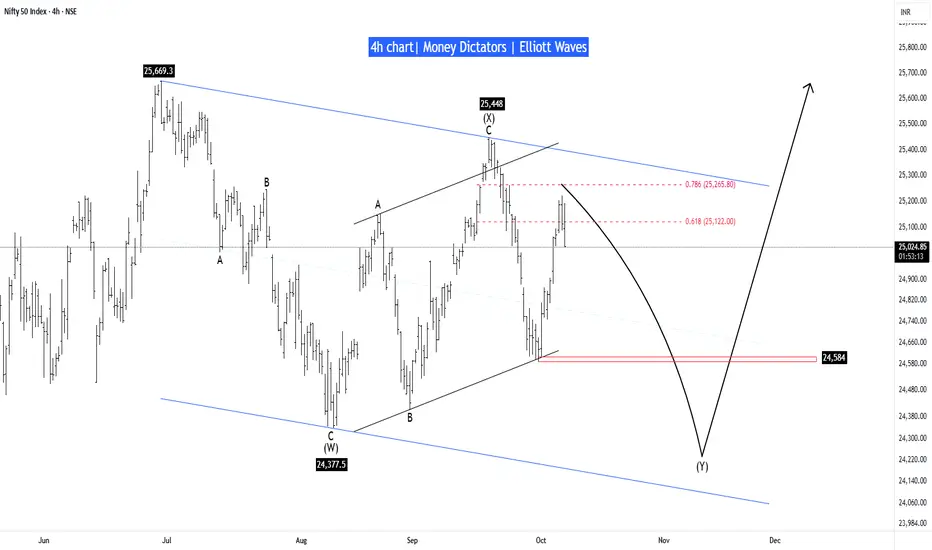
Nifty has reached the optimal supply zone and is expected to decline, at least up to 24,584. The retracement of wave A (0.786) could act as a strong resistance for a reversal. The lower boundary lies at 24,120, while 24,377 marks the low of wave (W). It’s better to consider the lower boundary as the potential maximum downside level.
Once the reversal level is identified, we will proceed toward the bullish path.
Stay tuned!
Money_Dictators
Thanks :)
Life-time free telegram channel - t.me/moneydictators
관련 발행물
면책사항
이 정보와 게시물은 TradingView에서 제공하거나 보증하는 금융, 투자, 거래 또는 기타 유형의 조언이나 권고 사항을 의미하거나 구성하지 않습니다. 자세한 내용은 이용 약관을 참고하세요.
Life-time free telegram channel - t.me/moneydictators
관련 발행물
면책사항
이 정보와 게시물은 TradingView에서 제공하거나 보증하는 금융, 투자, 거래 또는 기타 유형의 조언이나 권고 사항을 의미하거나 구성하지 않습니다. 자세한 내용은 이용 약관을 참고하세요.