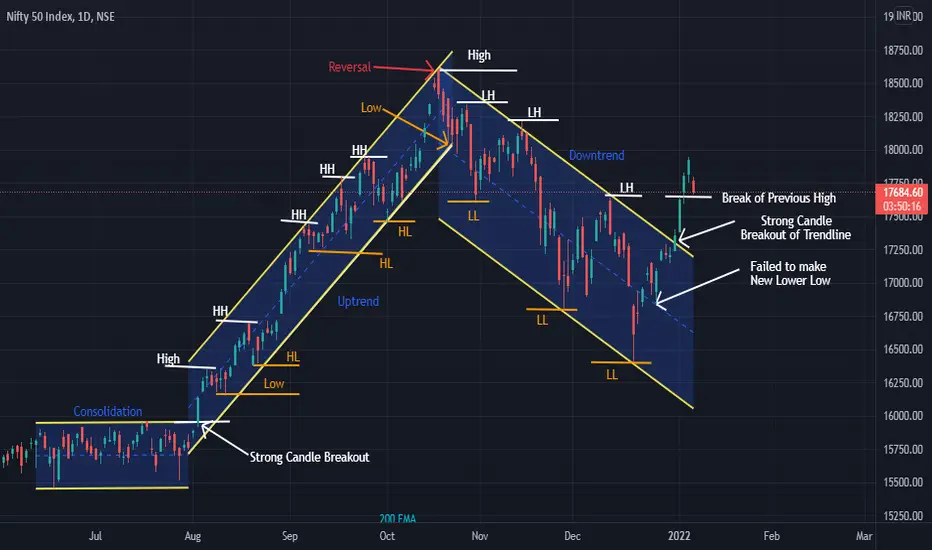
Beautiful Example of Price Action shown by Nifty on Daily chart.
First you can see Consolidation before BULL run.
When BULL run started you can see HH & HL forming in Uptrend Channel
once it reaches the Top it showed Reversal with Continuous red candles
After that a Downtrend with HL & LL forming
and it broke the channel upside - Showing Breakout of Resistance Line
Understanding Simple Price Action in one Chart Shown by Nifty
please do correlate by yourself also on charts. This is for educational and paper trading purpose only. Please consult your financial advisor before invest
면책사항
이 정보와 게시물은 TradingView에서 제공하거나 보증하는 금융, 투자, 거래 또는 기타 유형의 조언이나 권고 사항을 의미하거나 구성하지 않습니다. 자세한 내용은 이용 약관을 참고하세요.
면책사항
이 정보와 게시물은 TradingView에서 제공하거나 보증하는 금융, 투자, 거래 또는 기타 유형의 조언이나 권고 사항을 의미하거나 구성하지 않습니다. 자세한 내용은 이용 약관을 참고하세요.