🔎 Nifty Technical View
Higher Timeframe (4H)
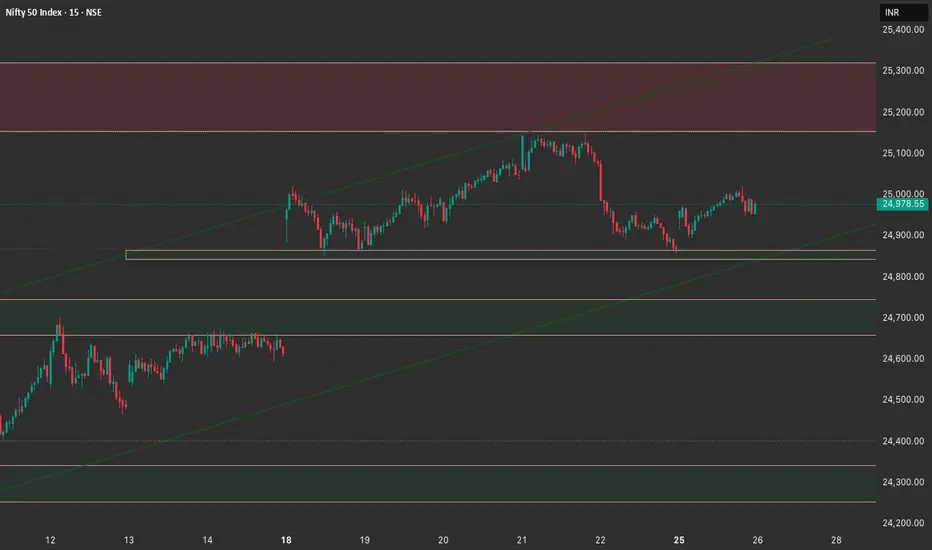
Resistance Zone: 25,200 – 25,300 (supply zone overhead).
Support Zone: 24,900 (immediate) and 24,700 (major demand).
Price tested the 24,900 demand and bounced slightly. Still within a short-term corrective phase inside an upward channel.
Medium Timeframe (1H)
Price is consolidating around 24,950 – 25,000 after a pullback.
Structure is still bullish as long as 24,900 holds.
A clean breakout above 25,050 can re-test 25,200 – 25,300.
But, if 24,900 breaks, momentum could shift bearish toward lower demand.
Lower Timeframe (15M)
Short-term demand OB at 24,920 – 24,950 is active.
Multiple BOS (break of structure) show intraday buyers are still defending, but rejection wicks indicate strong sellers near 25,050.
Key decision point: 24,900 – 24,950 zone.
📌 Trading Plan for 26th August
Long Setup
Trigger: Break & close above 25,050.
Targets: 25,100 → 25,200 → 25,300.
Stop-loss: Below 24,950.
Bias: Go long only on a strong breakout, otherwise avoid chop around 25k.
Short Setup
Trigger: Breakdown & close below 24,900.
Targets: 24,850 → 24,750 → 24,700.
Stop-loss: Above 24,950.
Bias: Play short if 24,900 gives way with momentum.
✅ Summary
Bias: Neutral-to-bullish as long as 24,900 holds.
Key Levels:
Resistance: 25,050 → 25,200 – 25,300.
Support: 24,950 → 24,900 → 24,700.
Tomorrow’s action likely revolves around 24,900 – 25,050 range; breakout or breakdown will decide trend expansion.
Higher Timeframe (4H)
Resistance Zone: 25,200 – 25,300 (supply zone overhead).
Support Zone: 24,900 (immediate) and 24,700 (major demand).
Price tested the 24,900 demand and bounced slightly. Still within a short-term corrective phase inside an upward channel.
Medium Timeframe (1H)
Price is consolidating around 24,950 – 25,000 after a pullback.
Structure is still bullish as long as 24,900 holds.
A clean breakout above 25,050 can re-test 25,200 – 25,300.
But, if 24,900 breaks, momentum could shift bearish toward lower demand.
Lower Timeframe (15M)
Short-term demand OB at 24,920 – 24,950 is active.
Multiple BOS (break of structure) show intraday buyers are still defending, but rejection wicks indicate strong sellers near 25,050.
Key decision point: 24,900 – 24,950 zone.
📌 Trading Plan for 26th August
Long Setup
Trigger: Break & close above 25,050.
Targets: 25,100 → 25,200 → 25,300.
Stop-loss: Below 24,950.
Bias: Go long only on a strong breakout, otherwise avoid chop around 25k.
Short Setup
Trigger: Breakdown & close below 24,900.
Targets: 24,850 → 24,750 → 24,700.
Stop-loss: Above 24,950.
Bias: Play short if 24,900 gives way with momentum.
✅ Summary
Bias: Neutral-to-bullish as long as 24,900 holds.
Key Levels:
Resistance: 25,050 → 25,200 – 25,300.
Support: 24,950 → 24,900 → 24,700.
Tomorrow’s action likely revolves around 24,900 – 25,050 range; breakout or breakdown will decide trend expansion.
면책사항
해당 정보와 게시물은 금융, 투자, 트레이딩 또는 기타 유형의 조언이나 권장 사항으로 간주되지 않으며, 트레이딩뷰에서 제공하거나 보증하는 것이 아닙니다. 자세한 내용은 이용 약관을 참조하세요.
면책사항
해당 정보와 게시물은 금융, 투자, 트레이딩 또는 기타 유형의 조언이나 권장 사항으로 간주되지 않으며, 트레이딩뷰에서 제공하거나 보증하는 것이 아닙니다. 자세한 내용은 이용 약관을 참조하세요.