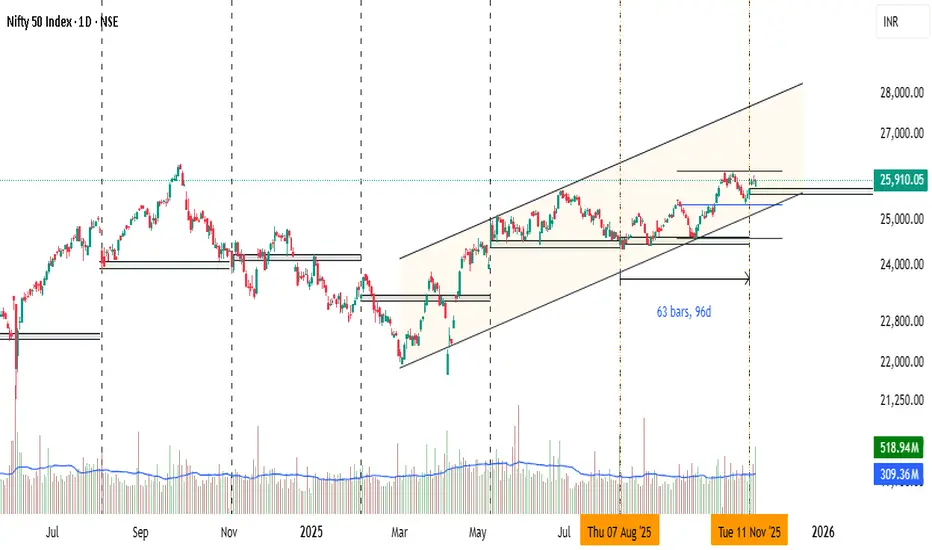
Professional traders often use time cycles as a filter within technical analysis:
What are Time Cycles?
Time Cycle Analysis is a subset or specialized branch of technical analysis that focuses exclusively on the timing of market turns using recurring time intervals, rather than price patterns or indicators.
It studies when price reversals or significant moves are likely to occur, based on:
Historical time intervals between highs/lows
Fixed calendar cycles (seasonal, lunar, anniversary dates)
Mathematical cycles (Fibonacci time zones, Gann time squares, Hurst cycles)
Key Time Cycle Methods:
Method Description
Seasonality e.g., "Sell in May and go away"
Anniversary Dates Markets often reverse near dates of past major highs/lows
Fibonacci Time Zones Vertical lines at Fib intervals (1, 2, 3, 5, 8, 13, 21 days/weeks) from a swing point
Gann Time Analysis Uses squares (e.g., 90-day, 144-day cycles), angles, and dates
Hurst Cycles Identifies dominant cycle lengths (e.g., 18-week, 40-week) using spectral analysis
Goal: Predict when a reversal or acceleration might occur, regardless of price structure.
Key Difference: Time Cycles vs. Technical Analysis
Aspect Technical Analysis (Broad) Time Cycle Analysis (Narrow)
Focus Price + Volume + Patterns Time intervals only
Core Question What is the trend/pattern? When will the turn happen?
Tool sIndicators, patterns, S/R Calendar dates, Fib time, Gann squares
Predicts Direction + levels Timing of potential reversals
Standalone? Yes Usually combined with TA for confirmation
Example "RSI oversold + double bottom → buy" "90 days from March low → expect top"
Analogy:
Technical Analysis = A full GPS system (route, speed, traffic, landmarks)
Time Cycles = Just the clock on the dashboard ("We always hit traffic at 5 PM")
Best Practice: Combine Both
Professional traders often use time cycles as a filter within technical analysis:
Price at support + RSI oversold
AND: We're 144 days from the last major low (Gann cycle)
→ High-probability long setup
Summary
Technical Analysis Time Cycle Analysis
Scope Broad (price, volume, patterns) Narrow (timing only)
Predicts Direction, levels Timing of turns
Relationship Parent method Sub-branch of TA
Time Cycles ≠ Separate from TA — they are a timing tool within technical analysis.
면책사항
해당 정보와 게시물은 금융, 투자, 트레이딩 또는 기타 유형의 조언이나 권장 사항으로 간주되지 않으며, 트레이딩뷰에서 제공하거나 보증하는 것이 아닙니다. 자세한 내용은 이용 약관을 참조하세요.
면책사항
해당 정보와 게시물은 금융, 투자, 트레이딩 또는 기타 유형의 조언이나 권장 사항으로 간주되지 않으며, 트레이딩뷰에서 제공하거나 보증하는 것이 아닙니다. 자세한 내용은 이용 약관을 참조하세요.
