Current NIFTY 50 (Yesterday's Close): 25,423.60
Overarching Theme: The Nifty is in a powerful, well-defined uptrend. The market structure, on a macro level, is unequivocally bullish, with a clear sequence of higher highs and higher lows. This trend is confirmed by the price staying within a rising channel and above key moving averages.
Detailed Market Structure Breakdown
4-Hour Chart (Macro Trend)
Structure: A textbook bullish trend. The price has been respecting an ascending channel since late August. The "Break of Structure" (BOS) near 25,100 was a significant event, confirming the continuation of the uptrend and a shift in the market's bias.
Key Levels:
Major Supply Zone (Resistance): 25,500 - 25,650. This is a critical psychological and technical resistance level. A break above this zone would signal a fresh, strong leg up and a new all-time high.
Major Demand Zone (Support): 25,050 - 25,100. This level is a powerful confluence of a prior breakout resistance and a Fair Value Gap (FVG), making it a high-probability demand zone. Any deep pullback to this area should be seen as a strong buying opportunity.
Outlook: The long-term trend remains firmly bullish. The Nifty's journey towards new highs is intact as long as it stays above its primary support levels.
1-Hour Chart (Intermediate View)
Structure: The 1H chart shows the recent momentum and minor pullbacks. The most recent bounce was a reaction from the 25,250 area, which acted as a solid demand zone. This shows that buyers are stepping in on even minor dips.
Key Levels:
Immediate Resistance: The high of the previous day, near 25,450.
Immediate Support: The 25,300 level, which coincides with the bottom of the rising channel. This is the first line of defense for the bulls today.
Outlook: The 1H chart suggests the market is in a "buy on dips" mode. A bounce from the 25,300 level would be a strong indicator of continued strength.
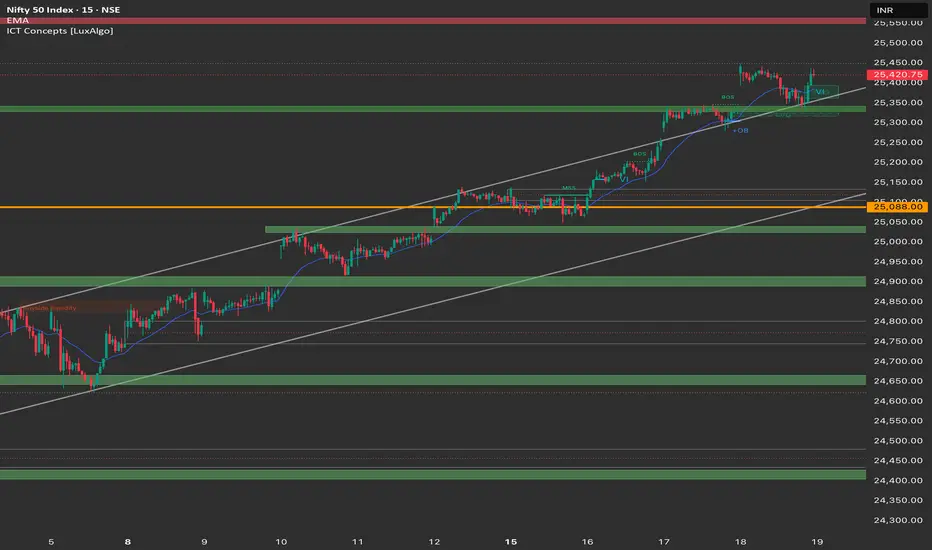
15-Minute Chart (Intraday View)
Structure: The 15M chart shows that after a strong gap-up and rally, the market has entered a period of consolidation. The price is currently range-bound.
Key Levels:
Intraday Resistance: 25,480. The high of the current consolidation.
Intraday Support: 25,400. The low of the current consolidation.
Outlook: This timeframe is currently neutral, waiting for a breakout. The direction of the break from this range will likely dictate the intraday trend.
📈 Today's Trade Plan (Friday, 19th September)
Market Outlook: The sentiment is bullish, fueled by global cues and domestic buying (DIIs). Nifty is expected to open with a positive bias.
Bullish Scenario (Primary Plan)
Justification: The multi-timeframe analysis is strongly bullish. A breakout from the 15M consolidation and a move towards the 4H chart resistance is the most probable path.
Entry: Place a long entry on a sustained break and 15-minute candle close above 25,480.
Stop Loss (SL): Below 25,400 to protect against a reversal into the previous range.
Targets:
T1: 25,550 (Psychological & minor resistance).
T2: 25,650 (Top of the 4H channel & next major target).
Bearish Scenario (Counter-Trend Plan)
Justification: This plan accounts for a potential fakeout or a deeper-than-expected pullback. It should be traded with caution.
Trigger: A confirmed breakdown and 15-minute candle close below 25,400.
Entry: Short entry on a breakdown retest of the 25,400 level.
Stop Loss (SL): Above 25,450.
Targets:
T1: 25,300 (First major intraday support).
T2: 25,250 (1H chart FVG demand zone).
Key Levels for Observation:
Immediate Decision Point: 25,400 - 25,480.
Bullish Confirmation: A break above 25,480.
Warning Sign: A drop below 25,400 would suggest a short-term correction is underway.
Ultimate Bullish Support: The 25,050 - 25,100 zone is the "line in the sand" for the long-term uptrend. A break below this would invalidate the current bullish structure on the macro chart.
Overarching Theme: The Nifty is in a powerful, well-defined uptrend. The market structure, on a macro level, is unequivocally bullish, with a clear sequence of higher highs and higher lows. This trend is confirmed by the price staying within a rising channel and above key moving averages.
Detailed Market Structure Breakdown
4-Hour Chart (Macro Trend)
Structure: A textbook bullish trend. The price has been respecting an ascending channel since late August. The "Break of Structure" (BOS) near 25,100 was a significant event, confirming the continuation of the uptrend and a shift in the market's bias.
Key Levels:
Major Supply Zone (Resistance): 25,500 - 25,650. This is a critical psychological and technical resistance level. A break above this zone would signal a fresh, strong leg up and a new all-time high.
Major Demand Zone (Support): 25,050 - 25,100. This level is a powerful confluence of a prior breakout resistance and a Fair Value Gap (FVG), making it a high-probability demand zone. Any deep pullback to this area should be seen as a strong buying opportunity.
Outlook: The long-term trend remains firmly bullish. The Nifty's journey towards new highs is intact as long as it stays above its primary support levels.
1-Hour Chart (Intermediate View)
Structure: The 1H chart shows the recent momentum and minor pullbacks. The most recent bounce was a reaction from the 25,250 area, which acted as a solid demand zone. This shows that buyers are stepping in on even minor dips.
Key Levels:
Immediate Resistance: The high of the previous day, near 25,450.
Immediate Support: The 25,300 level, which coincides with the bottom of the rising channel. This is the first line of defense for the bulls today.
Outlook: The 1H chart suggests the market is in a "buy on dips" mode. A bounce from the 25,300 level would be a strong indicator of continued strength.
15-Minute Chart (Intraday View)
Structure: The 15M chart shows that after a strong gap-up and rally, the market has entered a period of consolidation. The price is currently range-bound.
Key Levels:
Intraday Resistance: 25,480. The high of the current consolidation.
Intraday Support: 25,400. The low of the current consolidation.
Outlook: This timeframe is currently neutral, waiting for a breakout. The direction of the break from this range will likely dictate the intraday trend.
📈 Today's Trade Plan (Friday, 19th September)
Market Outlook: The sentiment is bullish, fueled by global cues and domestic buying (DIIs). Nifty is expected to open with a positive bias.
Bullish Scenario (Primary Plan)
Justification: The multi-timeframe analysis is strongly bullish. A breakout from the 15M consolidation and a move towards the 4H chart resistance is the most probable path.
Entry: Place a long entry on a sustained break and 15-minute candle close above 25,480.
Stop Loss (SL): Below 25,400 to protect against a reversal into the previous range.
Targets:
T1: 25,550 (Psychological & minor resistance).
T2: 25,650 (Top of the 4H channel & next major target).
Bearish Scenario (Counter-Trend Plan)
Justification: This plan accounts for a potential fakeout or a deeper-than-expected pullback. It should be traded with caution.
Trigger: A confirmed breakdown and 15-minute candle close below 25,400.
Entry: Short entry on a breakdown retest of the 25,400 level.
Stop Loss (SL): Above 25,450.
Targets:
T1: 25,300 (First major intraday support).
T2: 25,250 (1H chart FVG demand zone).
Key Levels for Observation:
Immediate Decision Point: 25,400 - 25,480.
Bullish Confirmation: A break above 25,480.
Warning Sign: A drop below 25,400 would suggest a short-term correction is underway.
Ultimate Bullish Support: The 25,050 - 25,100 zone is the "line in the sand" for the long-term uptrend. A break below this would invalidate the current bullish structure on the macro chart.
면책사항
이 정보와 게시물은 TradingView에서 제공하거나 보증하는 금융, 투자, 거래 또는 기타 유형의 조언이나 권고 사항을 의미하거나 구성하지 않습니다. 자세한 내용은 이용 약관을 참고하세요.
면책사항
이 정보와 게시물은 TradingView에서 제공하거나 보증하는 금융, 투자, 거래 또는 기타 유형의 조언이나 권고 사항을 의미하거나 구성하지 않습니다. 자세한 내용은 이용 약관을 참고하세요.