Nifty 50 – Immediate Trend Analysis (Hourly Chart)
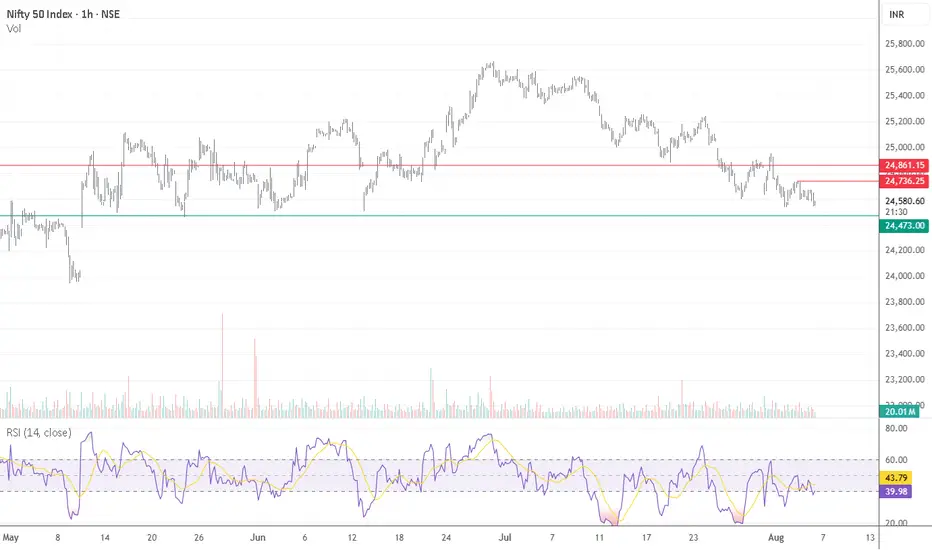
On the hourly chart, Nifty 50 is exhibiting a clear downtrend, forming a pattern of lower highs and lower lows—signaling weakness in the immediate term.
The index has now approached a crucial support zone, which held strong multiple times during May and June, leading to a notable upside reversal in the past. This makes the current level a key inflection point.
If this support level holds, a short-term bounce is likely.
However, a break below this zone could accelerate the decline, potentially taking the index quickly towards the 24,000 level.
Key Takeaway:
Monitor this support zone closely for confirmation of a bounce or a breakdown to position accordingly.
#Nifty50 #NiftyAnalysis #TechnicalAnalysis #StockMarketIndia #NiftySupport #HourlyChart #Downtrend #MarketUpdate #NSE #IndexWatch #TradingStrategy #BreakdownOrBounce #PriceAction #ChartAnalysis #NiftyLevels
면책사항
이 정보와 게시물은 TradingView에서 제공하거나 보증하는 금융, 투자, 거래 또는 기타 유형의 조언이나 권고 사항을 의미하거나 구성하지 않습니다. 자세한 내용은 이용 약관을 참고하세요.
면책사항
이 정보와 게시물은 TradingView에서 제공하거나 보증하는 금융, 투자, 거래 또는 기타 유형의 조언이나 권고 사항을 의미하거나 구성하지 않습니다. 자세한 내용은 이용 약관을 참고하세요.