Based on the charts and market data from Monday, September 22, the Nifty has experienced a significant correction, breaking below a key support level. The market sentiment has shifted from strongly bullish to cautiously bearish in the short term.
Detailed Market Structure Breakdown
4 Hour Chart (Macro Trend)
Structure: The long-term trend remains bullish, as the index is still trading above its August lows. However, Monday's strong bearish candle, which broke below the rising channel, indicates a significant shift in the immediate trend. The bulls' control has been challenged, and a deeper correction is now more probable.
Key Levels:
Major Supply (Resistance): 25,500-25,600. This level has proven to be a very strong supply zone, rejecting the price on multiple occasions.
Major Demand (Support): The most critical support is the 25,050-25,100 zone. This area, which includes a prior breakout level and a FVG (Fair Value Gap), is now the key "line in the sand" for the long-term bullish trend. A break below this would signal a major trend reversal.
1-Hour Chart (Intermediate View)
Structure: The 1H chart shows a clear MSS (Market Structure Shift) to the downside. The price has broken below the lower trendline of the rising channel and its immediate support, confirming the short-term bearish bias. The index is now making lower highs and lower lows.
Key Levels:
Immediate Resistance: The 25,300 level, which was a strong support, has now become a crucial resistance. Any bounce is likely to be met with selling pressure in this zone.
Immediate Support: The next key support level is the 25,200 mark. This is a psychological level that was tested and broken on Monday. A retest of this level is likely.
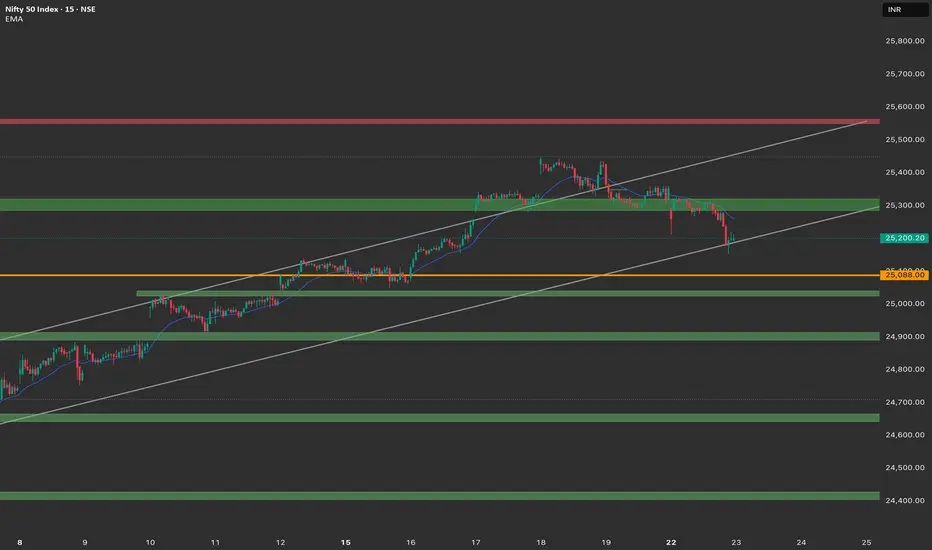
15-Minute Chart (Intraday View)
Structure: The 15M chart provides a clearer picture of the intraday fall. The price is showing a small consolidation after the sharp decline. This is likely a pause before the next move.
Key Levels:
Intraday Supply: The 25,250 area, which is the high of the recent consolidation.
Intraday Demand: The low of the recent consolidation and the intraday low, near 25,200.
Outlook: The intraday bias is bearish. The market is likely to continue its downward movement unless it can reclaim the 25,300 resistance level.
Trade Plan: 23rd September
Market Outlook: The market is now in a short-term bearish phase. A "sell on rise" strategy seems more favorable, but a strong reversal from a key support level is also a possibility.
Bearish Scenario (Primary Plan)
Justification: The market has shown a clear change in structure with a breakdown of key levels. The path of least resistance is to the downside.
Entry: Look for a short entry if the price retests the 25,300 level and shows signs of rejection with a bearish candlestick pattern. Alternatively, a breakdown and 15-minute close below 25,200 would trigger a short entry.
Stop Loss (SL): Place a stop loss above 25,350.
Targets:
T1: 25,100 (Next major support).
T2: 25,050 (Psychological level and strong demand zone).
Bullish Scenario (Counter-Trend Plan)
Justification: This is a counter-trend plan and should be approached with caution. It is based on the possibility of a strong bounce from a key support level.
Trigger: A strong bullish reversal candle (e.g., a hammer or engulfing pattern) near the 25,100 - 25,050 demand zone.
Entry: Long entry on a confirmed bounce from the demand zone.
Stop Loss (SL): Below 25,000.
Targets:
T1: 25,250 (Intraday resistance).
T2: 25,400 (Recent swing high).
Key Levels for Observation:
Immediate Decision Point: The 25,200 - 25,300 zone.
Bearish Confirmation: A break and sustained move below 25,200.
Bullish Confirmation: A recapture of the 25,300 level.
Line in the Sand: The 25,050 - 25,100 zone. The overall bullish trend is in jeopardy if this level is decisively broken.
Detailed Market Structure Breakdown
4 Hour Chart (Macro Trend)
Structure: The long-term trend remains bullish, as the index is still trading above its August lows. However, Monday's strong bearish candle, which broke below the rising channel, indicates a significant shift in the immediate trend. The bulls' control has been challenged, and a deeper correction is now more probable.
Key Levels:
Major Supply (Resistance): 25,500-25,600. This level has proven to be a very strong supply zone, rejecting the price on multiple occasions.
Major Demand (Support): The most critical support is the 25,050-25,100 zone. This area, which includes a prior breakout level and a FVG (Fair Value Gap), is now the key "line in the sand" for the long-term bullish trend. A break below this would signal a major trend reversal.
1-Hour Chart (Intermediate View)
Structure: The 1H chart shows a clear MSS (Market Structure Shift) to the downside. The price has broken below the lower trendline of the rising channel and its immediate support, confirming the short-term bearish bias. The index is now making lower highs and lower lows.
Key Levels:
Immediate Resistance: The 25,300 level, which was a strong support, has now become a crucial resistance. Any bounce is likely to be met with selling pressure in this zone.
Immediate Support: The next key support level is the 25,200 mark. This is a psychological level that was tested and broken on Monday. A retest of this level is likely.
15-Minute Chart (Intraday View)
Structure: The 15M chart provides a clearer picture of the intraday fall. The price is showing a small consolidation after the sharp decline. This is likely a pause before the next move.
Key Levels:
Intraday Supply: The 25,250 area, which is the high of the recent consolidation.
Intraday Demand: The low of the recent consolidation and the intraday low, near 25,200.
Outlook: The intraday bias is bearish. The market is likely to continue its downward movement unless it can reclaim the 25,300 resistance level.
Trade Plan: 23rd September
Market Outlook: The market is now in a short-term bearish phase. A "sell on rise" strategy seems more favorable, but a strong reversal from a key support level is also a possibility.
Bearish Scenario (Primary Plan)
Justification: The market has shown a clear change in structure with a breakdown of key levels. The path of least resistance is to the downside.
Entry: Look for a short entry if the price retests the 25,300 level and shows signs of rejection with a bearish candlestick pattern. Alternatively, a breakdown and 15-minute close below 25,200 would trigger a short entry.
Stop Loss (SL): Place a stop loss above 25,350.
Targets:
T1: 25,100 (Next major support).
T2: 25,050 (Psychological level and strong demand zone).
Bullish Scenario (Counter-Trend Plan)
Justification: This is a counter-trend plan and should be approached with caution. It is based on the possibility of a strong bounce from a key support level.
Trigger: A strong bullish reversal candle (e.g., a hammer or engulfing pattern) near the 25,100 - 25,050 demand zone.
Entry: Long entry on a confirmed bounce from the demand zone.
Stop Loss (SL): Below 25,000.
Targets:
T1: 25,250 (Intraday resistance).
T2: 25,400 (Recent swing high).
Key Levels for Observation:
Immediate Decision Point: The 25,200 - 25,300 zone.
Bearish Confirmation: A break and sustained move below 25,200.
Bullish Confirmation: A recapture of the 25,300 level.
Line in the Sand: The 25,050 - 25,100 zone. The overall bullish trend is in jeopardy if this level is decisively broken.
면책사항
해당 정보와 게시물은 금융, 투자, 트레이딩 또는 기타 유형의 조언이나 권장 사항으로 간주되지 않으며, 트레이딩뷰에서 제공하거나 보증하는 것이 아닙니다. 자세한 내용은 이용 약관을 참조하세요.
면책사항
해당 정보와 게시물은 금융, 투자, 트레이딩 또는 기타 유형의 조언이나 권장 사항으로 간주되지 않으며, 트레이딩뷰에서 제공하거나 보증하는 것이 아닙니다. 자세한 내용은 이용 약관을 참조하세요.