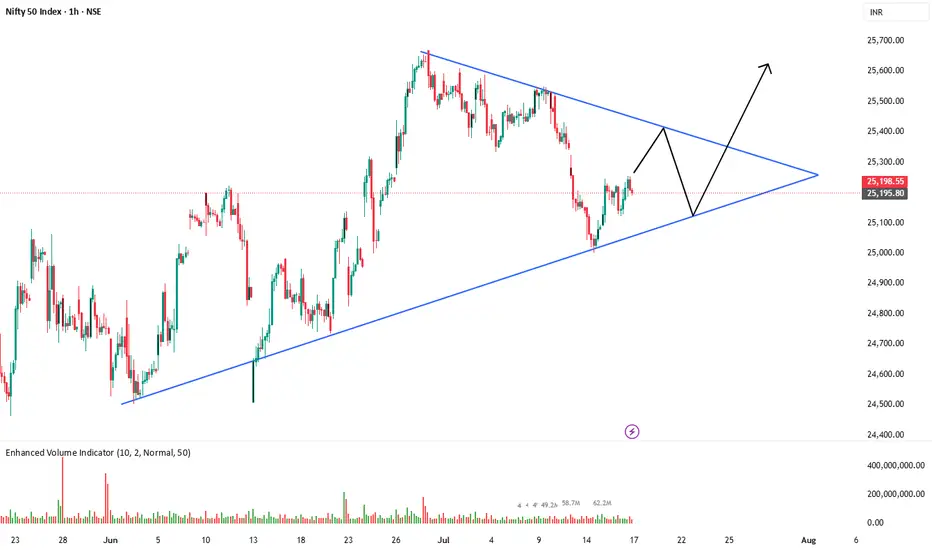
Nifty is currently consolidating within a symmetrical triangle pattern on the 1-hour chart. Price is respecting both the rising support and descending resistance trendlines.
Key observations:
Clear higher lows indicate underlying bullish pressure.
Lower highs show selling pressure near resistance.
Expecting a possible pullback toward the lower trendline before a potential breakout to the upside.
Trade Plan (if breakout occurs):
📈 Bullish breakout above the upper trendline could lead to a sharp rally.
✅ Confirmation needed with strong volume and candle close above resistance.
Invalid if price breaks below the support trendline.
Stay alert for a breakout or breakdown — both scenarios possible, but current structure slightly favors bulls.
면책사항
이 정보와 게시물은 TradingView에서 제공하거나 보증하는 금융, 투자, 거래 또는 기타 유형의 조언이나 권고 사항을 의미하거나 구성하지 않습니다. 자세한 내용은 이용 약관을 참고하세요.
면책사항
이 정보와 게시물은 TradingView에서 제공하거나 보증하는 금융, 투자, 거래 또는 기타 유형의 조언이나 권고 사항을 의미하거나 구성하지 않습니다. 자세한 내용은 이용 약관을 참고하세요.