~~ Technical Analysis ~~
Short-Term (Daily/Weekly):
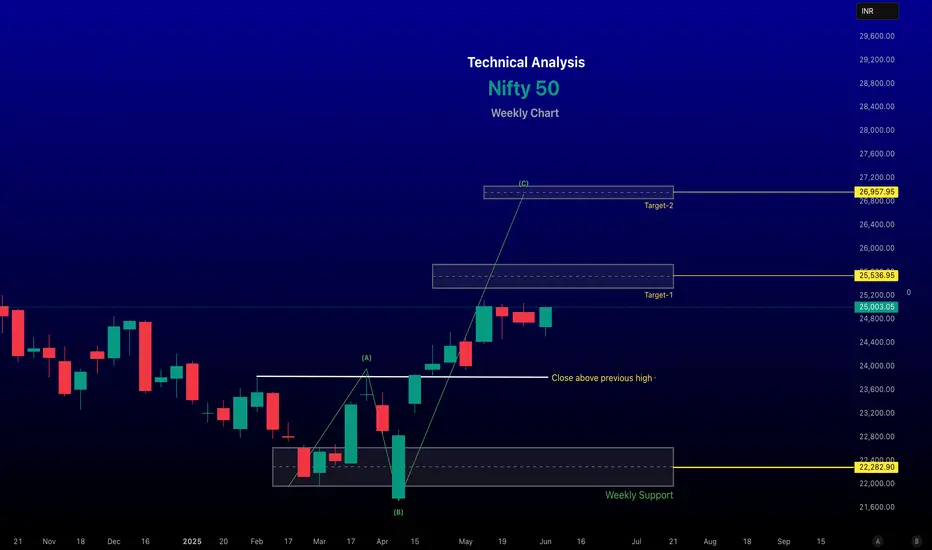
The Nifty 50 is currently trading within an ascending channel on the daily/weekly chart, indicating a bullish structure. However, it faces resistance in the 25,050–25,070 range. A breakout above this could target 25,300–25,600, while a drop below 24,700 may signal short-term weakness.
Recent suggest the index is testing key support levels, with the 200-day Exponential Moving Average (EMA) and a major trend line around 23,300–23,600 acting as critical support. A break below this could indicate a bearish shift.
The Relative Strength Index (RSI) on the daily chart has previously hit oversold levels (below 30) in March 2025, suggesting potential for a bounce if similar conditions reoccur.
-- Disclaimer --
This analysis is based on recent technical data and market sentiment from web sources. It is for informational and educational purposes only and not financial advice. Trading involves high risks, and past performance does not guarantee future results. Always conduct your own research or consult a SEBI-registered advisor before trading.
#Boost and comment will be highly appreciated
Short-Term (Daily/Weekly):
The Nifty 50 is currently trading within an ascending channel on the daily/weekly chart, indicating a bullish structure. However, it faces resistance in the 25,050–25,070 range. A breakout above this could target 25,300–25,600, while a drop below 24,700 may signal short-term weakness.
Recent suggest the index is testing key support levels, with the 200-day Exponential Moving Average (EMA) and a major trend line around 23,300–23,600 acting as critical support. A break below this could indicate a bearish shift.
The Relative Strength Index (RSI) on the daily chart has previously hit oversold levels (below 30) in March 2025, suggesting potential for a bounce if similar conditions reoccur.
-- Disclaimer --
This analysis is based on recent technical data and market sentiment from web sources. It is for informational and educational purposes only and not financial advice. Trading involves high risks, and past performance does not guarantee future results. Always conduct your own research or consult a SEBI-registered advisor before trading.
#Boost and comment will be highly appreciated
renderwithme
관련 발행물
면책사항
이 정보와 게시물은 TradingView에서 제공하거나 보증하는 금융, 투자, 거래 또는 기타 유형의 조언이나 권고 사항을 의미하거나 구성하지 않습니다. 자세한 내용은 이용 약관을 참고하세요.
renderwithme
관련 발행물
면책사항
이 정보와 게시물은 TradingView에서 제공하거나 보증하는 금융, 투자, 거래 또는 기타 유형의 조언이나 권고 사항을 의미하거나 구성하지 않습니다. 자세한 내용은 이용 약관을 참고하세요.