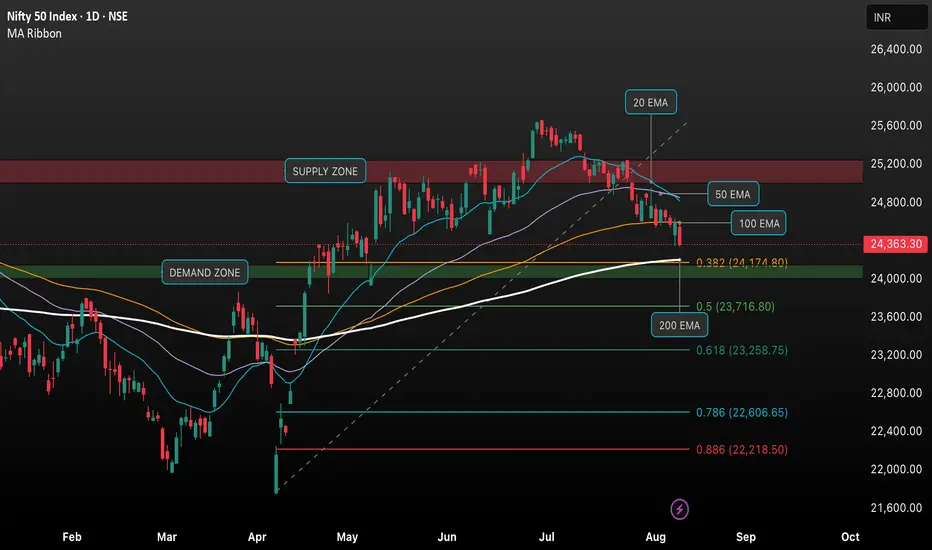
This chart presents the daily price action of the NIFTY 50 index using technical indicators and key support/resistance zones. The analysis includes:
• EMA Ribbon: Showing 20, 50, 100, and 200 EMAs, highlighting current trend direction.
• Supply Zone (Resistance): Marked near 25,200–25,600, where selling pressure is historically strong.
• Demand Zone (Support): Located around 24,100–24,400, indicating potential buying interest.
• Fibonacci Retracement Levels: Key support at 0.382 (24,174.80), 0.5 (23,716.80), and 0.618 (23,258.75) levels for swing trade reference.
• Current Price: 24,363.30, trending downward (-0.95%).
• Watch for price action near the Demand Zone and 200 EMA as critical support levels, as a break below may signal further downside.
• The chart is ideal for both swing and intraday traders assessing possible reversal or continuation setups.
면책사항
이 정보와 게시물은 TradingView에서 제공하거나 보증하는 금융, 투자, 거래 또는 기타 유형의 조언이나 권고 사항을 의미하거나 구성하지 않습니다. 자세한 내용은 이용 약관을 참고하세요.
면책사항
이 정보와 게시물은 TradingView에서 제공하거나 보증하는 금융, 투자, 거래 또는 기타 유형의 조언이나 권고 사항을 의미하거나 구성하지 않습니다. 자세한 내용은 이용 약관을 참고하세요.