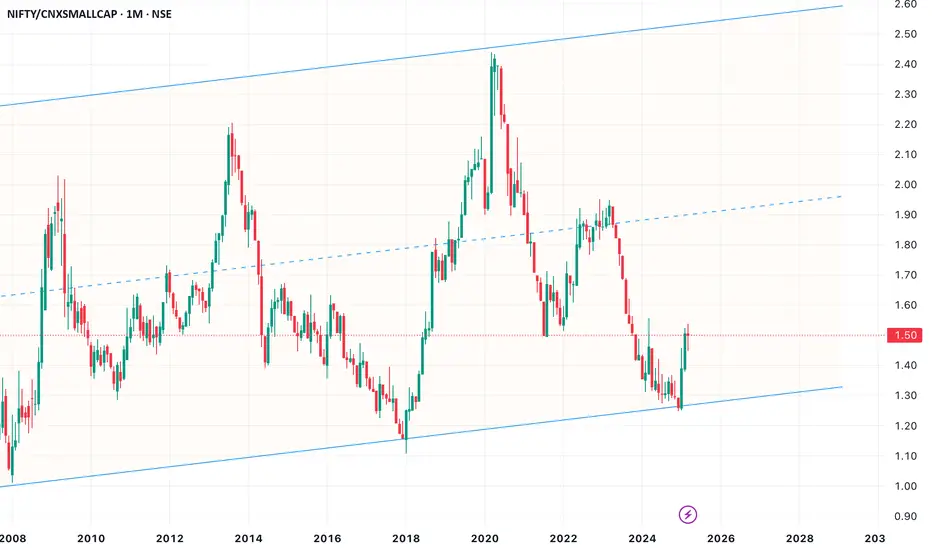
This ratio chart between LargeCaps and SmallCaps has been a good retail sentiment indicator. At the extremes, it has been a good contrarian indicator
When large-cap underperformance reaches an extreme low and starts to reverse, like in 2024 Sep, one of the 3 scenarios unfolds and seems to last 18 to 24 months
1. Both LargeCaps and SmallCaps correct, but SmallCaps correct even more
2. LargeCaps are relatively stable but SmallCaps are correcting
3. LargeCaps are rallying and SmallCaps are yet to catch up
Let's see if Scenario 1 >>> Scenario 2
Ps: This is NOT an investment advice
면책사항
해당 정보와 게시물은 금융, 투자, 트레이딩 또는 기타 유형의 조언이나 권장 사항으로 간주되지 않으며, 트레이딩뷰에서 제공하거나 보증하는 것이 아닙니다. 자세한 내용은 이용 약관을 참조하세요.
면책사항
해당 정보와 게시물은 금융, 투자, 트레이딩 또는 기타 유형의 조언이나 권장 사항으로 간주되지 않으며, 트레이딩뷰에서 제공하거나 보증하는 것이 아닙니다. 자세한 내용은 이용 약관을 참조하세요.