🔎 Market Structure Analysis
4H Chart
Price is moving inside a rising channel, but repeatedly rejecting around 24,840–24,880 supply zone.
Recent rejection shows short-term weakness, but the structure is still holding higher-lows around 24,650–24,670 (support).
Key imbalance (FVG) visible near 24,650, which could act as a demand zone.
Bias: Sideways-to-bullish unless 24,650 is broken.
1H Chart
Price attempted a breakout above 24,840, failed, and pulled back into the 24,720–24,750 zone.
This zone coincides with channel support + minor demand.
As long as 24,700 holds, structure favors bounce continuation.
Break below 24,700 = short-term bearish with downside open to 24,560.
Bias: Neutral with bullish tilt (unless 24,700 fails).
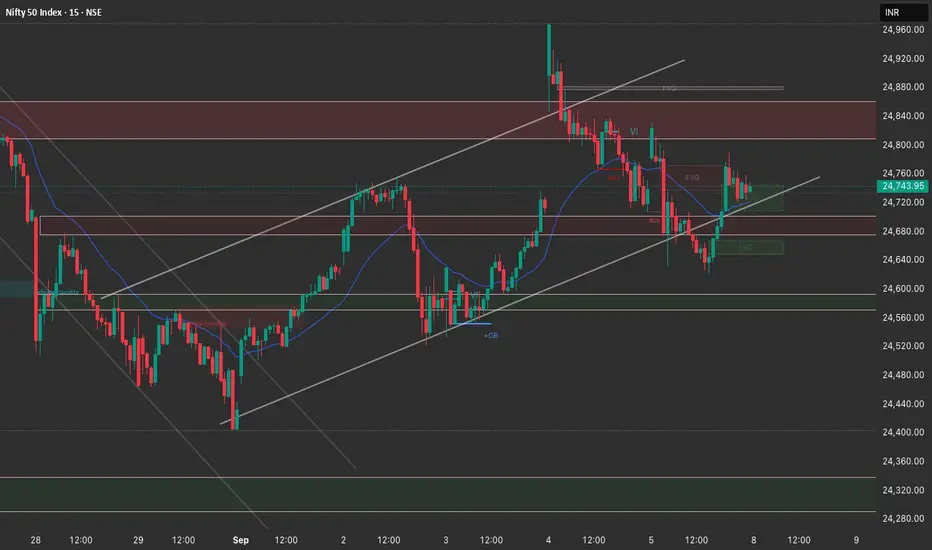
15M Chart
Micro-structure shows failed breakout → liquidity grab above 24,840, followed by BOS (break of structure) downward.
Price is consolidating just above support trendline.
Short-term buyers defending 24,700–24,720.
Bias: Expect volatility early session — direction depends on 24,700 hold/break.
📌 Trade Plan for 8th September (Monday)
Long Scenario (preferred bias)
Entry Zone: 24,700–24,720 support
Targets:
T1: 24,820
T2: 24,880 (channel high / supply)
T3: 25,000+ (if breakout holds)
Stop Loss: Below 24,650
Short Scenario (if breakdown happens)
Trigger: Break & close below 24,700 on 15M/1H
Entry Zone: 24,690–24,710 (retest entry)
Targets:
T1: 24,560
T2: 24,450
T3: 24,300 (major demand)
Stop Loss: Above 24,760
🎯 Summary
Above 24,700 → Look for longs into 24,880–25,000.
Below 24,700 → Shorts open till 24,560–24,300.
Expect whipsaws around open; best is to wait for 15M structure confirmation.
4H Chart
Price is moving inside a rising channel, but repeatedly rejecting around 24,840–24,880 supply zone.
Recent rejection shows short-term weakness, but the structure is still holding higher-lows around 24,650–24,670 (support).
Key imbalance (FVG) visible near 24,650, which could act as a demand zone.
Bias: Sideways-to-bullish unless 24,650 is broken.
1H Chart
Price attempted a breakout above 24,840, failed, and pulled back into the 24,720–24,750 zone.
This zone coincides with channel support + minor demand.
As long as 24,700 holds, structure favors bounce continuation.
Break below 24,700 = short-term bearish with downside open to 24,560.
Bias: Neutral with bullish tilt (unless 24,700 fails).
15M Chart
Micro-structure shows failed breakout → liquidity grab above 24,840, followed by BOS (break of structure) downward.
Price is consolidating just above support trendline.
Short-term buyers defending 24,700–24,720.
Bias: Expect volatility early session — direction depends on 24,700 hold/break.
📌 Trade Plan for 8th September (Monday)
Long Scenario (preferred bias)
Entry Zone: 24,700–24,720 support
Targets:
T1: 24,820
T2: 24,880 (channel high / supply)
T3: 25,000+ (if breakout holds)
Stop Loss: Below 24,650
Short Scenario (if breakdown happens)
Trigger: Break & close below 24,700 on 15M/1H
Entry Zone: 24,690–24,710 (retest entry)
Targets:
T1: 24,560
T2: 24,450
T3: 24,300 (major demand)
Stop Loss: Above 24,760
🎯 Summary
Above 24,700 → Look for longs into 24,880–25,000.
Below 24,700 → Shorts open till 24,560–24,300.
Expect whipsaws around open; best is to wait for 15M structure confirmation.
면책사항
이 정보와 게시물은 TradingView에서 제공하거나 보증하는 금융, 투자, 거래 또는 기타 유형의 조언이나 권고 사항을 의미하거나 구성하지 않습니다. 자세한 내용은 이용 약관을 참고하세요.
면책사항
이 정보와 게시물은 TradingView에서 제공하거나 보증하는 금융, 투자, 거래 또는 기타 유형의 조언이나 권고 사항을 의미하거나 구성하지 않습니다. 자세한 내용은 이용 약관을 참고하세요.