Hello Traders,
NIFTY50 declined the hole week to a 10620 intraday low and reversed sharply during Fridays session to a close at 10724. The candlestick pattern leave a „Hammer-candle“ but this one is a bearish one. How to interpret this behavior.
Well, by using the a/d-Ratio, which endet the day @ 0.56 we have the message tha makes sence relative to price. Decling index and declining Ratio. Using the TRIN (ARMS Index) we get another message. TRIN closed at .76 which is normally a „bullish sign“! This is in contrary to each other.
Using the intraday a/d-Ratio to price we can view, that the bottom at Fridays session got touched around noon and price reversed since to a close at 10724, and, confirming in addition, the Ratio has risen to, moving sideways within the last trading hour.
To my view the message is, that traders put a lot of buying pressure (money) into the market to keep it rising, and a shortterm bottom is in place, or it is a bull trap and NIFTY will decline after a short pullback.
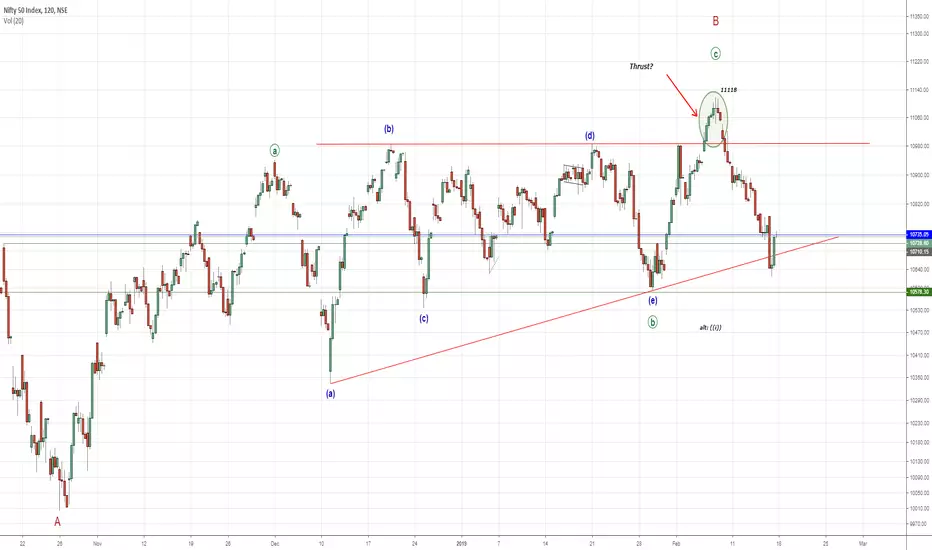
Note, at the NIFTY50 chart, that a rising trendline, connecting the lows of 1004-10583 was violated but price bounced back above this one. A decline and a daily close below that line will be a bearish sign and a door opener to lower price stil, while a decline below 10583 will increase the odds that the triangle formation is confirmed.
On the other hand, a rise above the high at 11118 will eliminate the triangle and something else is developing.
Following the Dow-Theory yoou will observe, that only NIFTY IT is howing strong behavior, while all the other indexes are showing weakness and, to my view, corrective pattern, may in a wave C of (4)! This is a "non-confirmation" as it often occurs at trend reversal points.
So, stay tuned and we will be alert if some interesting will develop. We will disucc it at this pages.
Have a great weekend.....
ruebennase
Feel free to ask or comment.
Trading this analyze is at your own risk!

NIFTY50 declined the hole week to a 10620 intraday low and reversed sharply during Fridays session to a close at 10724. The candlestick pattern leave a „Hammer-candle“ but this one is a bearish one. How to interpret this behavior.
Well, by using the a/d-Ratio, which endet the day @ 0.56 we have the message tha makes sence relative to price. Decling index and declining Ratio. Using the TRIN (ARMS Index) we get another message. TRIN closed at .76 which is normally a „bullish sign“! This is in contrary to each other.
Using the intraday a/d-Ratio to price we can view, that the bottom at Fridays session got touched around noon and price reversed since to a close at 10724, and, confirming in addition, the Ratio has risen to, moving sideways within the last trading hour.
To my view the message is, that traders put a lot of buying pressure (money) into the market to keep it rising, and a shortterm bottom is in place, or it is a bull trap and NIFTY will decline after a short pullback.
Note, at the NIFTY50 chart, that a rising trendline, connecting the lows of 1004-10583 was violated but price bounced back above this one. A decline and a daily close below that line will be a bearish sign and a door opener to lower price stil, while a decline below 10583 will increase the odds that the triangle formation is confirmed.
On the other hand, a rise above the high at 11118 will eliminate the triangle and something else is developing.
Following the Dow-Theory yoou will observe, that only NIFTY IT is howing strong behavior, while all the other indexes are showing weakness and, to my view, corrective pattern, may in a wave C of (4)! This is a "non-confirmation" as it often occurs at trend reversal points.
So, stay tuned and we will be alert if some interesting will develop. We will disucc it at this pages.
Have a great weekend.....
ruebennase
Feel free to ask or comment.
Trading this analyze is at your own risk!
면책사항
이 정보와 게시물은 TradingView에서 제공하거나 보증하는 금융, 투자, 거래 또는 기타 유형의 조언이나 권고 사항을 의미하거나 구성하지 않습니다. 자세한 내용은 이용 약관을 참고하세요.
면책사항
이 정보와 게시물은 TradingView에서 제공하거나 보증하는 금융, 투자, 거래 또는 기타 유형의 조언이나 권고 사항을 의미하거나 구성하지 않습니다. 자세한 내용은 이용 약관을 참고하세요.