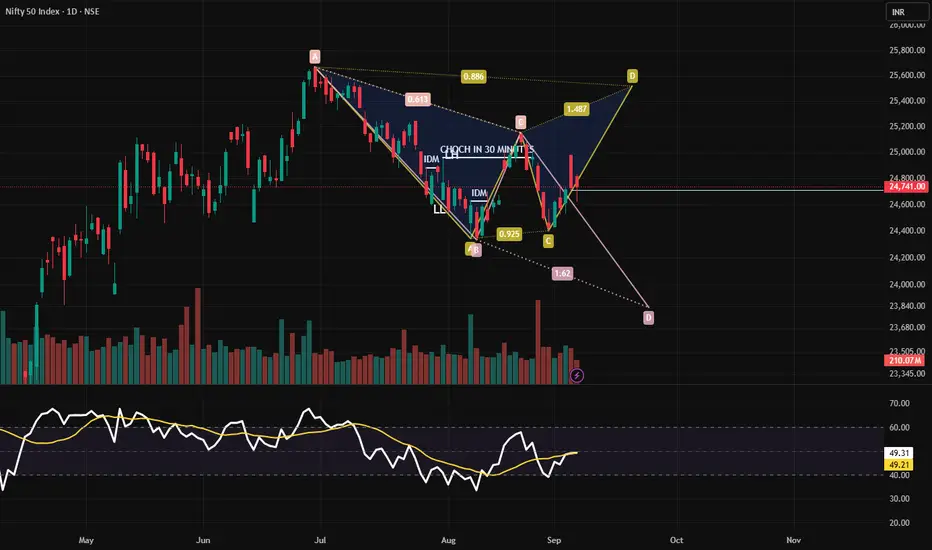
A harmonic structure (XABCD) is unfolding with both bullish recovery attempts and potential downside extension.
🔹 Pattern & Fibonacci Levels
XA: Fall from 25,800 → 24,150.
AB: Pullback to ~0.613 Fib retracement.
BC: Bounce to ~0.925 Fib (~24,500).
CD: Projection zones:
Upside target near 25,600 (1.487 extension).
Downside risk toward 23,800–23,500 (1.62 projection).
🔹 Key Zones
Resistance: 24,820 – 25,000, followed by 25,600.
Support: 24,400 initially, with deeper risk toward 23,800–23,500.
Current Price: 24,741 (+0.03%)
🔹 Momentum
RSI: At 49.21, hovering around neutral; shows indecision.
Volume: Spikes during recent swings suggest strong participation.
Moving averages: Trying to flatten out, signaling a possible reversal attempt.
📌 Trading View
Sustained close above 24,820–25,000 may trigger a rally toward 25,600.
Breakdown below 24,400 could accelerate fall to 23,800–23,500.
Neutral RSI suggests market awaiting a breakout direction.
#Nifty50 #TechnicalAnalysis #HarmonicPattern #TradingView #IndianMarkets
면책사항
이 정보와 게시물은 TradingView에서 제공하거나 보증하는 금융, 투자, 거래 또는 기타 유형의 조언이나 권고 사항을 의미하거나 구성하지 않습니다. 자세한 내용은 이용 약관을 참고하세요.
면책사항
이 정보와 게시물은 TradingView에서 제공하거나 보증하는 금융, 투자, 거래 또는 기타 유형의 조언이나 권고 사항을 의미하거나 구성하지 않습니다. 자세한 내용은 이용 약관을 참고하세요.