Friends I have made an visual representation of where the Nifty would be heading based on the
Method i follow as wave theory
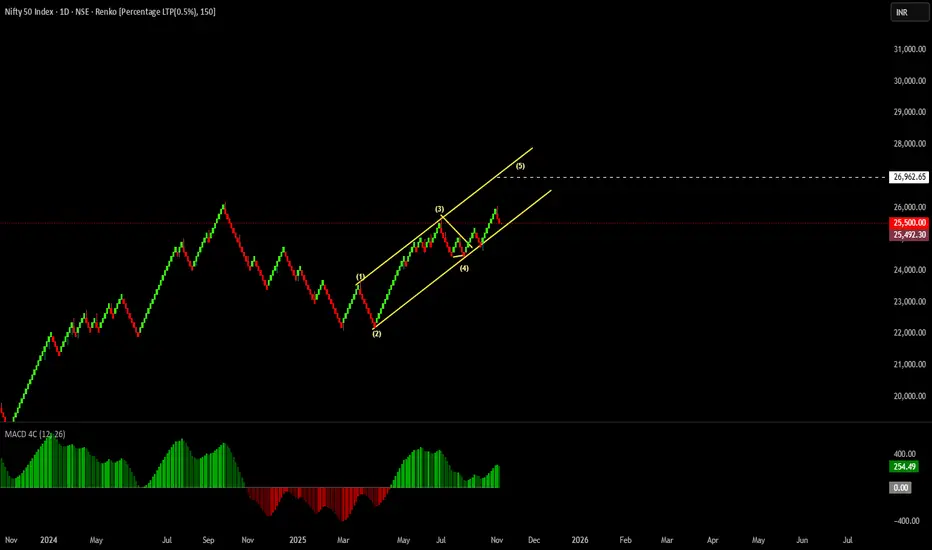
Interesting to note the price is in the channel or representation of channel fits the price movement
Also You can note i have selected 0.50 % Box size in Ranko Bars , which represents the movement in harmonic or linear movements based on fixed price bars
Now i have applied wave theory which represents the methods i follow as Analyst
Wave 2 Represents sharp correction
Wave 4 Represents Complex Running Flat Pattern leaving second leg correction fell short to represent the urgency in the Movement
Now I have forecasted it with mathematical calculations which may represents an measured move method to take Profits
All this is an education content
I hope you understand it and then hit the like button
Good luck
Method i follow as wave theory
Interesting to note the price is in the channel or representation of channel fits the price movement
Also You can note i have selected 0.50 % Box size in Ranko Bars , which represents the movement in harmonic or linear movements based on fixed price bars
Now i have applied wave theory which represents the methods i follow as Analyst
Wave 2 Represents sharp correction
Wave 4 Represents Complex Running Flat Pattern leaving second leg correction fell short to represent the urgency in the Movement
Now I have forecasted it with mathematical calculations which may represents an measured move method to take Profits
All this is an education content
I hope you understand it and then hit the like button
Good luck
액티브 트레이드
I did try to tell you that Majority of Market participents are looking for New highs , all you can do now is trail the stop on your holding in Nifty , Enjoy the ride 면책사항
해당 정보와 게시물은 금융, 투자, 트레이딩 또는 기타 유형의 조언이나 권장 사항으로 간주되지 않으며, 트레이딩뷰에서 제공하거나 보증하는 것이 아닙니다. 자세한 내용은 이용 약관을 참조하세요.
면책사항
해당 정보와 게시물은 금융, 투자, 트레이딩 또는 기타 유형의 조언이나 권장 사항으로 간주되지 않으며, 트레이딩뷰에서 제공하거나 보증하는 것이 아닙니다. 자세한 내용은 이용 약관을 참조하세요.