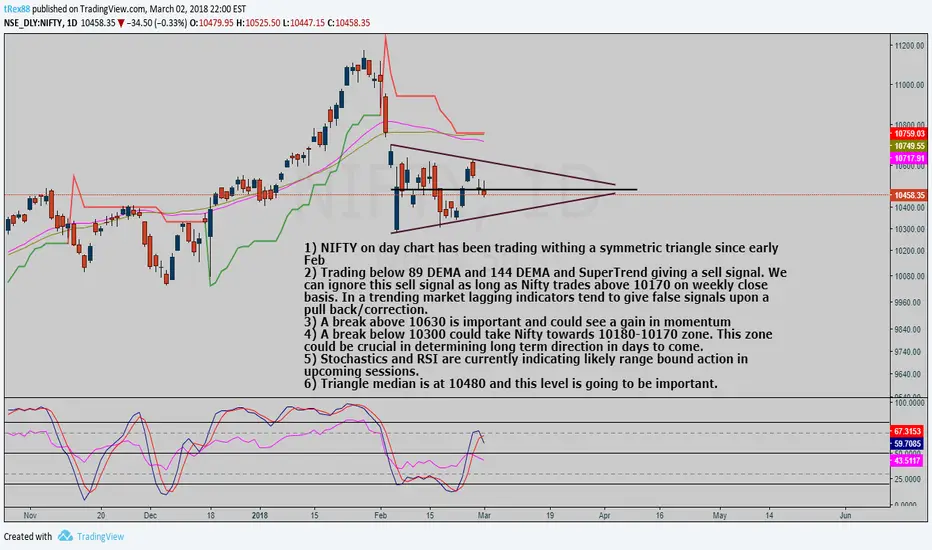
1) NIFTY on day chart has been trading withing a symmetric triangle since early Feb
2) Trading below 89 DEMA and 144 DEMA and SuperTrend giving a sell signal. We can ignore this sell signal as long as Nifty trades above 10170 on weekly close basis. In a trending market lagging indicators tend to give false signals upon a pull back/correction.
3) A break above 10630 is important and could see a gain in momentum
4) A break below 10300 could take Nifty towards 10180-10170 zone. This zone could be crucial in determining long term direction in days to come.
5) Stochastics and RSI are currently indicating likely range bound action in upcoming sessions.
6) Triangle median is at 10480 and this level is going to be important.
노트
Symmetric triangle as seen on hourly chart노트
Symmetric triangle as seen on hourly chart노트
Nifty appears to have taken bounce at the triangle bottom and now could move towards the median at 10480.It could face some resistance at 10430-10420 before touching the median
노트
Nifty faced resistance at 10430-10420 and could not sustain. Hence moved it towards the triangle bottom. On hourly chart there was a strong fight and finally triangle bottom was broken. We can expect 10180 in upcoming trading session
면책사항
해당 정보와 게시물은 금융, 투자, 트레이딩 또는 기타 유형의 조언이나 권장 사항으로 간주되지 않으며, 트레이딩뷰에서 제공하거나 보증하는 것이 아닙니다. 자세한 내용은 이용 약관을 참조하세요.
면책사항
해당 정보와 게시물은 금융, 투자, 트레이딩 또는 기타 유형의 조언이나 권장 사항으로 간주되지 않으며, 트레이딩뷰에서 제공하거나 보증하는 것이 아닙니다. 자세한 내용은 이용 약관을 참조하세요.