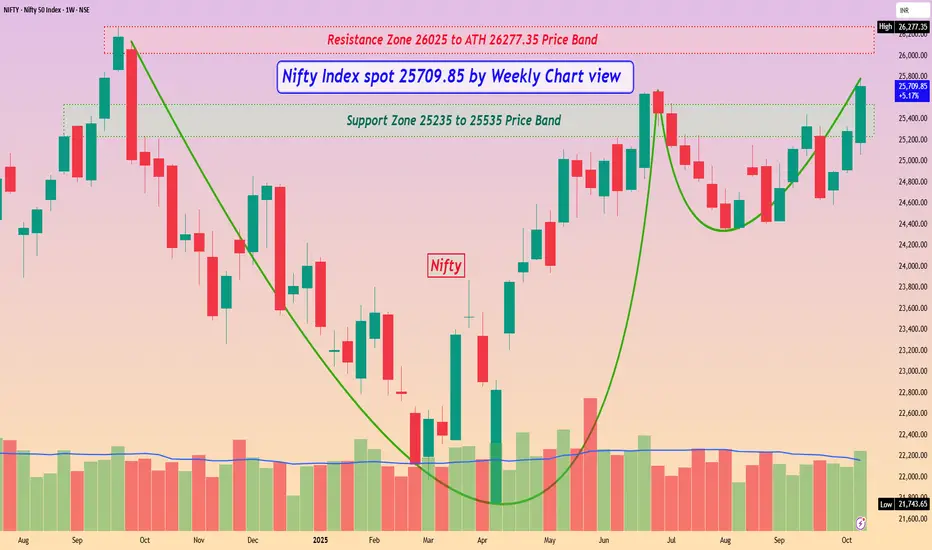
Nifty Index spot 25709.85 by Weekly Chart view
- Support Zone 25235 to 25535 Price Band
- Resistance Zone 26025 to ATH 26277.35 Price Band
- Crystal Clear Bullish Cup & Handle formed around Support Zone
- Lets hope for the best to happen based on this Nifty 50 Index Chart setup
- Sharing this beautiful Nifty Index Chart setup, courtesy by a curious Co-Learners observation 😊👍🏽🤞🏽
관련 발행물
면책사항
해당 정보와 게시물은 금융, 투자, 트레이딩 또는 기타 유형의 조언이나 권장 사항으로 간주되지 않으며, 트레이딩뷰에서 제공하거나 보증하는 것이 아닙니다. 자세한 내용은 이용 약관을 참조하세요.
관련 발행물
면책사항
해당 정보와 게시물은 금융, 투자, 트레이딩 또는 기타 유형의 조언이나 권장 사항으로 간주되지 않으며, 트레이딩뷰에서 제공하거나 보증하는 것이 아닙니다. 자세한 내용은 이용 약관을 참조하세요.