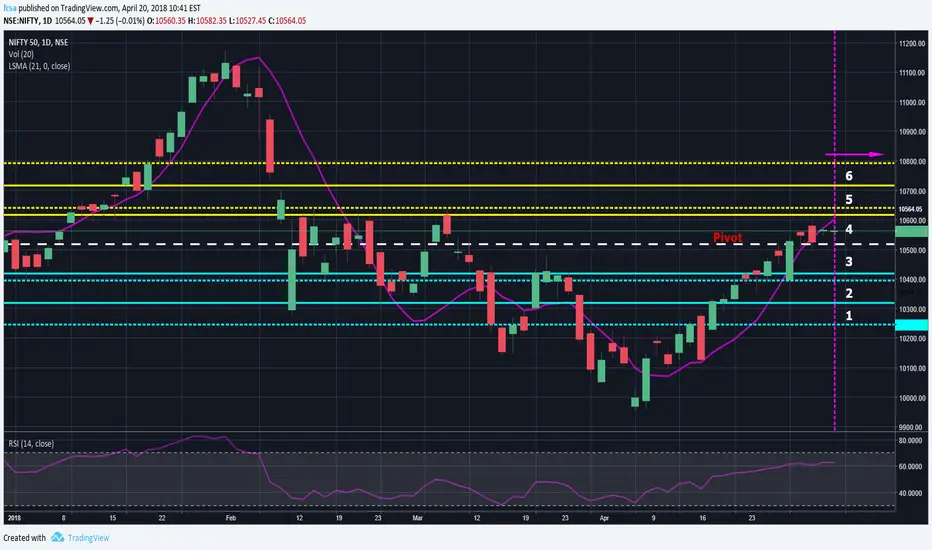
These are the results of some range calculations I have been using regularly for some months. These Fibonacci based ranges work for any candle duration. This is a variation of Classical Pivots and Camarilla .
The present calculation is based on price action of the week April 16th-20th 2018. Valid from April 23rd-27th 2018. Can be used in combination with the Daily ranges in my earlier chart
SL and targets depend on where the CMP is - the choice is one of the lines or dotted lines above/below CMP.
It helps to trade with the trend but this works pretty well even against the trend for short candle durations.
Please observe the performance of these zones before committing to trades.
Please add a comment... Positive feedback and constructive criticism are important to authors and the community.
노트
My weekly and daily probability ranges have proved quite accurate. Load latest bars and check.면책사항
이 정보와 게시물은 TradingView에서 제공하거나 보증하는 금융, 투자, 거래 또는 기타 유형의 조언이나 권고 사항을 의미하거나 구성하지 않습니다. 자세한 내용은 이용 약관을 참고하세요.
면책사항
이 정보와 게시물은 TradingView에서 제공하거나 보증하는 금융, 투자, 거래 또는 기타 유형의 조언이나 권고 사항을 의미하거나 구성하지 않습니다. 자세한 내용은 이용 약관을 참고하세요.