📊 Multi-Timeframe Market Structure
🔹 4H Chart (Swing Bias)
Clear bearish structure: consecutive red candles post 25,100 rejection.
FVG zones left at 24,950–25,050 and 24,600–24,650 → both acting as supply areas now.
Price broke structure (MSS) and continues respecting descending channel.
Current price = 24,433, sitting near minor demand (24,350–24,300).
EMA slope down, confirming bearish pressure.
✅ Bias: Bearish
📌 Swing resistance = 24,600–24,650
📌 Swing demand = 24,350–24,300
🔹 1H Chart (Intraday Bias)
Multiple BOS (Break of Structure) to the downside, confirming lower highs & lower lows.
Recent bounce attempt from 24,400 failed → retested FVG around 24,550–24,600 and rejected.
Price trading inside a tight descending channel, consolidating near support.
EMA acting as dynamic resistance aligning with supply.
✅ Bias: Bearish
📌 Resistance = 24,550–24,600
📌 Demand = 24,350–24,300
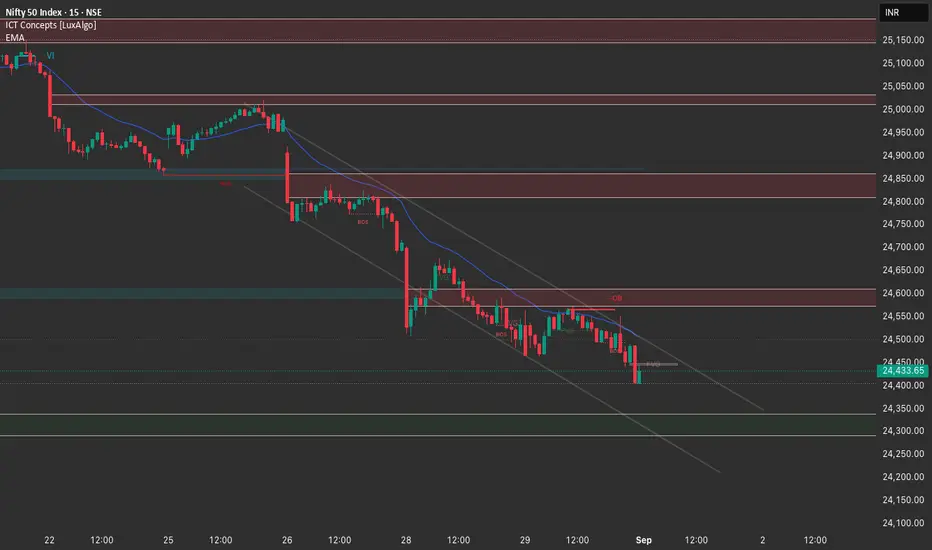
🔹 15M Chart (Execution Level)
Micro-structure shows clean liquidity sweeps & BOS lower.
A bearish order block at 24,550–24,600 is capping upside moves intraday.
Price repeatedly rejecting mid-channel levels → clear intraday sellers present.
Possible liquidity grab below 24,400 before next leg lower.
✅ Bias: Bearish (scalp possible longs only if 24,350–24,300 holds strongly).
📌 OB Supply = 24,550–24,600
📌 Liquidity Pool = below 24,400
🎯 Trade Plan for 1st Sept
📌 Primary Plan (Short Bias – Sell on Rally)
Look for price to retest 24,550–24,600 (OB + FVG zone).
If rejection shows on 15M → Enter Short.
Target 1: 24,350
Target 2: 24,250 (if demand cracks)
Stop-loss: Above 24,650
📌 Alternate Plan (Liquidity Long – Countertrend)
If price flushes into 24,350–24,300 and prints bullish reversal (15M BOS + engulf),
Enter a scalp long.
Target: 24,500–24,550 retest
Stop-loss: Below 24,250
✅ Overall Bias for 1st Sept: Bearish, Sell the rallies. Only consider longs on sharp liquidity sweep at 24,300 zone.
🔹 4H Chart (Swing Bias)
Clear bearish structure: consecutive red candles post 25,100 rejection.
FVG zones left at 24,950–25,050 and 24,600–24,650 → both acting as supply areas now.
Price broke structure (MSS) and continues respecting descending channel.
Current price = 24,433, sitting near minor demand (24,350–24,300).
EMA slope down, confirming bearish pressure.
✅ Bias: Bearish
📌 Swing resistance = 24,600–24,650
📌 Swing demand = 24,350–24,300
🔹 1H Chart (Intraday Bias)
Multiple BOS (Break of Structure) to the downside, confirming lower highs & lower lows.
Recent bounce attempt from 24,400 failed → retested FVG around 24,550–24,600 and rejected.
Price trading inside a tight descending channel, consolidating near support.
EMA acting as dynamic resistance aligning with supply.
✅ Bias: Bearish
📌 Resistance = 24,550–24,600
📌 Demand = 24,350–24,300
🔹 15M Chart (Execution Level)
Micro-structure shows clean liquidity sweeps & BOS lower.
A bearish order block at 24,550–24,600 is capping upside moves intraday.
Price repeatedly rejecting mid-channel levels → clear intraday sellers present.
Possible liquidity grab below 24,400 before next leg lower.
✅ Bias: Bearish (scalp possible longs only if 24,350–24,300 holds strongly).
📌 OB Supply = 24,550–24,600
📌 Liquidity Pool = below 24,400
🎯 Trade Plan for 1st Sept
📌 Primary Plan (Short Bias – Sell on Rally)
Look for price to retest 24,550–24,600 (OB + FVG zone).
If rejection shows on 15M → Enter Short.
Target 1: 24,350
Target 2: 24,250 (if demand cracks)
Stop-loss: Above 24,650
📌 Alternate Plan (Liquidity Long – Countertrend)
If price flushes into 24,350–24,300 and prints bullish reversal (15M BOS + engulf),
Enter a scalp long.
Target: 24,500–24,550 retest
Stop-loss: Below 24,250
✅ Overall Bias for 1st Sept: Bearish, Sell the rallies. Only consider longs on sharp liquidity sweep at 24,300 zone.
면책사항
해당 정보와 게시물은 금융, 투자, 트레이딩 또는 기타 유형의 조언이나 권장 사항으로 간주되지 않으며, 트레이딩뷰에서 제공하거나 보증하는 것이 아닙니다. 자세한 내용은 이용 약관을 참조하세요.
면책사항
해당 정보와 게시물은 금융, 투자, 트레이딩 또는 기타 유형의 조언이나 권장 사항으로 간주되지 않으며, 트레이딩뷰에서 제공하거나 보증하는 것이 아닙니다. 자세한 내용은 이용 약관을 참조하세요.