📊 NIFTY TRADING PLAN – 15th May 2025 (15-Min Chart Structure Analysis)
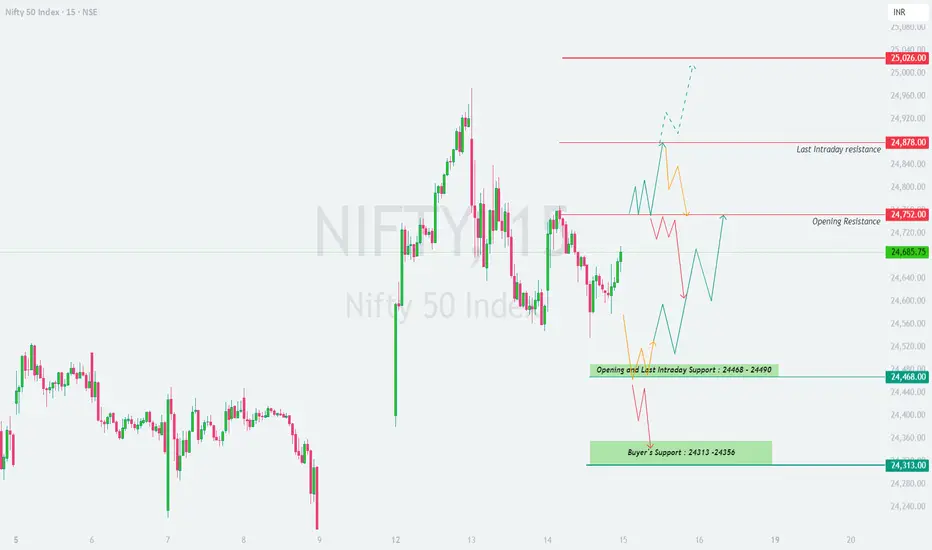
Nifty closed at 24,685.75 on 14-May-2025. Based on the chart setup, price is attempting to break out from consolidation but still trades below the crucial resistance level of 24,752. Support remains around 24,468–24,490, and below that, a key demand zone lies at 24,313–24,356.
We will consider a Gap Opening to be 100+ points as per standard practice.
🟢 SCENARIO 1: GAP-UP OPENING (Above 24,785)
(Gap up of 100+ points above last close)
- []If Nifty opens above 24,785, it enters the Last Intraday Resistance Zone of 24,878–25,026.
[]A direct open into resistance could invite profit booking or a reversal unless bulls show strength.
[]Wait for the first 15–30 minutes — if Nifty forms a strong bullish candle and sustains above 25,026, it confirms a continuation rally. You can consider a long entry with a target of 25,100+ and stop-loss below 24,950.
[]However, if price struggles to cross or shows rejection candles around 24,878–25,000, then look for shorting opportunities with downside targets of 24,752 and 24,690. - Do not chase a gap-up at open. Let structure confirm strength before acting.
👉 Educational Insight: Gaps into resistance zones often get filled if early momentum fails. Price needs strong follow-through to avoid being faded.
🟨 SCENARIO 2: FLAT OPENING (Between 24,600 – 24,750)
(Minor move from previous close)- []If Nifty opens between 24,600 and 24,750, it remains within the previous range — suggesting possible sideways action or a breakout setup.
[]The upside breakout level is 24,752. A candle close above this with volume can trigger bullish momentum towards 24,878 and 25,026.
[]On the downside, support lies near 24,468–24,490. If that zone breaks, Nifty may slip to 24,313–24,356.
[]Ideal strategy: Wait for price to break above 24,752 or below 24,468 and then trade with the trend. - Inside this zone, avoid aggressive trades — let market establish a clear direction.
👉 Educational Insight: Flat openings after consolidation days can lead to strong trending moves once breakout levels are breached. Don’t preempt; react to structure.
🔻 SCENARIO 3: GAP-DOWN OPENING (Below 24,590)
(Gap-down of 100+ points)- []A gap-down below 24,590 brings Nifty closer to the key support zone of 24,468–24,490.
[]If price opens and sustains below 24,468, it confirms a breakdown and can extend losses toward 24,313–24,356 (Buyer’s Support Zone).
[]Look for breakdown + retest structure. A bearish candle rejection near 24,468–24,490 post-open offers a high-probability shorting setup.
[]On the contrary, if price reverses from 24,468 or 24,313 with strong bullish candles (like hammer or engulfing), you can consider long trades for intraday pullbacks with targets back to 24,600–24,685. - Avoid bottom fishing blindly. Let structure confirm reversal or continuation.
👉 Educational Insight: Gap-downs near support zones can trap both bulls and bears. Always let confirmation come through – don’t force entries on emotion.
💡 RISK MANAGEMENT & OPTIONS TRADING TIPS:- []⚠️ Don’t chase premiums in first 5–10 mins — let volatility settle.
[]📌 Prefer ATM or slightly ITM options for intraday directional trades.
[]📊 Use spreads (e.g., Bull Call or Bear Put) to limit risk in breakout/breakdown setups.
[]⏳ Don’t hold out-of-the-money options too long — theta decay can erode value quickly.
[]📉 Always have a stop-loss or defined risk — either on candle structure or option premium basis.
[]💰 Risk only 1–2% of your trading capital per trade.
👉 Pro Tip: Treat option premiums like a stock — don’t average losers, and use trailing SL to lock profits when trades move in your favor.
📌 SUMMARY & CONCLUSION:
🔹 Immediate Resistance Zone: 24,752 – 25,026
🔹 Immediate Support Zone: 24,468 – 24,490
🔹 Trend Reversal Support: 24,313 – 24,356
🔹 Breakout Confirmation: Above 25,026
🔹 Breakdown Confirmation: Below 24,468
🔹 No Trade Zone: Between 24,600 – 24,750 unless breakout confirmed
The market structure suggests a possible breakout or reversal in play depending on opening action. A patient trader should let the first few candles guide the direction. Stay disciplined, don’t predict — prepare, react, and protect capital.
⚠️ DISCLAIMER:
I am not a SEBI-registered analyst. This trading plan is shared for educational purposes only. Please consult with your financial advisor or do your own analysis before taking any trades. Markets are uncertain — trade responsibly.
- []⚠️ Don’t chase premiums in first 5–10 mins — let volatility settle.
- []A gap-down below 24,590 brings Nifty closer to the key support zone of 24,468–24,490.
- []If Nifty opens between 24,600 and 24,750, it remains within the previous range — suggesting possible sideways action or a breakout setup.
면책사항
해당 정보와 게시물은 금융, 투자, 트레이딩 또는 기타 유형의 조언이나 권장 사항으로 간주되지 않으며, 트레이딩뷰에서 제공하거나 보증하는 것이 아닙니다. 자세한 내용은 이용 약관을 참조하세요.
면책사항
해당 정보와 게시물은 금융, 투자, 트레이딩 또는 기타 유형의 조언이나 권장 사항으로 간주되지 않으며, 트레이딩뷰에서 제공하거나 보증하는 것이 아닙니다. 자세한 내용은 이용 약관을 참조하세요.